Chapter 41: Visual Reasoning Data Engineering: Chart Evidence, Medical Images, and Tool-Call Trajectories
Abstract
This chapter discusses how visual data moves from object recognition toward evidence organization and executable reasoning through two specialized cases: multi-chart infographic reasoning and medical image tool-calling. Multi-chart infographic reasoning emphasizes cross-chart evidence aggregation, numerical relations, and multi-step reasoning chains; MedImage-ToolVQA emphasizes ROI, masks, bounding boxes, and tool-call trajectories. Both cases require datasets to record visual evidence, question structure, reasoning processes, and human-review boundaries together.
Keywords
visual reasoning; chart question answering; medical images; tool calling; ROI; multimodal evaluation
Case A: Multi-Chart Infographics: Cross-Chart Evidence Aggregation and Multi-Step Reasoning
Case A: Learning Objectives
After studying this case, readers should be able to:
- Distinguish the one-image, one-question paradigm of traditional single-chart VQA from the data-design requirements of real compound infographic reasoning.
- Explain why compound infographics naturally require cross-chart data aggregation, serial multi-step calculation, and joint visual-context reasoning.
- Understand the sample organization built from 354 native infographics and 1,917 chained subquestions, including the decision to preserve whole-image multi-subchart layouts.
- Identify how random combinations of 23 subchart types and 13 question types increase the difficulty of cross-format data reading and multi-step reasoning.
- Analyze typical model failures such as legend misreading, cross-chart data confusion, and cascading errors from earlier calculations.
Case A.1: Problem Scenario: Limits of Single-Chart VQA
Case A.1.1 Boundary of Traditional Single-Chart VQA
Mainstream chart VQA datasets such as ChartQA (Masry et al. 2022), FigureQA (Kahou et al. 2017), and PlotQA (Methani et al. 2020) usually follow a one-image, one-question, single-chart paradigm. One sample image contains one independent chart, and all data, legends, labels, and values needed for answering are contained in that single chart. The model mainly needs to locate coordinates, read annotated numbers, and perform a one-step arithmetic or classification operation (Kafle et al. 2018; Zhu et al. 2025).
At the task level, single-chart VQA mostly stops at single-step extraction: maximum lookup, category sum, or one ratio calculation. It lacks cross-view data linkage (Masry et al. 2025; Xie et al. 2026). In standardized lab datasets, chart styles are usually cleaned up: legends are neat, axes are unambiguous, partitions are clear, and there are few surrounding notes. This differs fundamentally from native infographics in the open web and commercial publications.
In real deployments, models trained only on single-chart data become unbalanced. They may read local pixel-level values well but lack cross-region association. Annual-report infographics, public-health visualizations, market-research reports, and industry dashboards rarely use only one chart. Designers split indicators into multiple subcharts, each carrying category statistics, time trends, geographic distribution, risk comparison, or explanatory notes. Final conclusions often require integrating several subcharts, so the single-chart paradigm does not match the scenario.
Case A.1.2 Reasoning Characteristics of Compound Infographics
A compound infographic is a nested visual carrier. It is one image file divided into several physical regions. Each region may contain a different chart type, accompanied by global legends, region notes, side text, and warning annotations (Mathew et al. 2021). Compared with single charts, real compound infographic reasoning has three core requirements.
- Cross-chart data aggregation. Different statistical dimensions are split across subcharts. In the shark-attack case, county-level historical attacks, state-level attacks over the last decade, and accidental-death comparisons appear in separate regions. Complex questions require aggregating data from multiple views.
- Multi-step serial numerical calculation. Real questions form chains. First identify a target region, then use that region's state to retrieve another value, then compare against another state. Earlier answers become later inputs.
- Visual and contextual reasoning. Important information often appears in legends, side notes, symbols, footnotes, and natural-language annotations rather than axis values. The model must combine visual symbols and text context.
Case A.1.3 Benchmark Gap and Dataset Significance
Current public multimodal chart-reasoning benchmark datasets worldwide show an obvious supply gap: there are many manually synthesized simulation chart datasets, while native real compound infographic samples crawled from web pages, newspapers, and popular-science publications remain scarce. To reduce annotation difficulty, most datasets manually split multi-subchart infographics into multiple independent images, destroying the original image's spatial associations and contextual logic (Foroutan et al. 2025).
Against this background, the multi-chart infographic reasoning dataset starts from native real infographic crawling and preserves the original structure: multiple subcharts in the same on-screen layout, globally shared legends, and interleaved regional notes. Unlike the above construction methods that depend on web crawling, we use multimodal large models to automatically synthesize charts and question-answer pairs, filling the benchmark gap for real-scenario cross-chart reasoning evaluation.
For algorithm research, this dataset pushes VQA models beyond “single-chart reading” toward subchart segmentation, cross-view memory storage, and multi-step calculation-chain reasoning, matching industrial scenarios such as financial data analysis, market-information interpretation, and public-health data assessment.
The self-built dataset is available on Hugging Face: https://huggingface.co/datasets/xychen-zh/multi-chart-infographic-reasoning, along with a similar dataset https://huggingface.co/datasets/ustc-lab/ChartQwen. We recommend utilizing the MindSpore framework, with the corresponding GitHub repository available at https://github.com/xychen-zh/multi-chart-infographic-reasoning-mindspore.
Case A.2: Dataset Overview
The dataset is described from four perspectives: sample size, domain coverage, chart types, and question types.
Case A.2.1 Quantitative Scale
- Image samples: 354 screened real-world compound infographics. Because high-quality native multi-subchart infographics on the web are scarce, the current sample size is explicitly treated as small and reserved for later expansion. Each image is stored as one complete infographic and is not manually split into separate chart images. Original layout, shared legends, and annotation positions are preserved as much as possible, so the visual browsing logic remains close to how humans read infographics.
- QA samples: 1,917 logically connected multi-step subquestions. Each infographic contains several dependent subquestions, with questions and answers generated with large-model assistance and verified by human annotation. Each infographic also includes one additional unanswerable question to test refusal and robustness, preventing models from overfitting by fabricating data. On average, each infographic has about 5.41 valid reasoning subquestions plus one unanswerable test question, close to how people ask step-by-step questions in real use.
Case A.2.2 Domain Coverage Across 28 Fields
The dataset samples across 28 vertical fields covering public life, industry, research, entertainment, and economics: animals, business, career & jobs, home & garden, computers & internet, industry, law and legal, lifestyle, education, energy, entertainment, environment, finance & money, food & drink, health & beauty, pregnancy & parenting, marketing, politics and history, people, real estate, shopping, science, social media, sports, technology, transportation, and travel.
Multi-domain design reduces overfitting to a single theme. Chart conventions, legends, and domain abbreviations differ across fields, raising the difficulty of visual-context reasoning.
Figure 41-1 illustrates the corresponding workflow or structure.
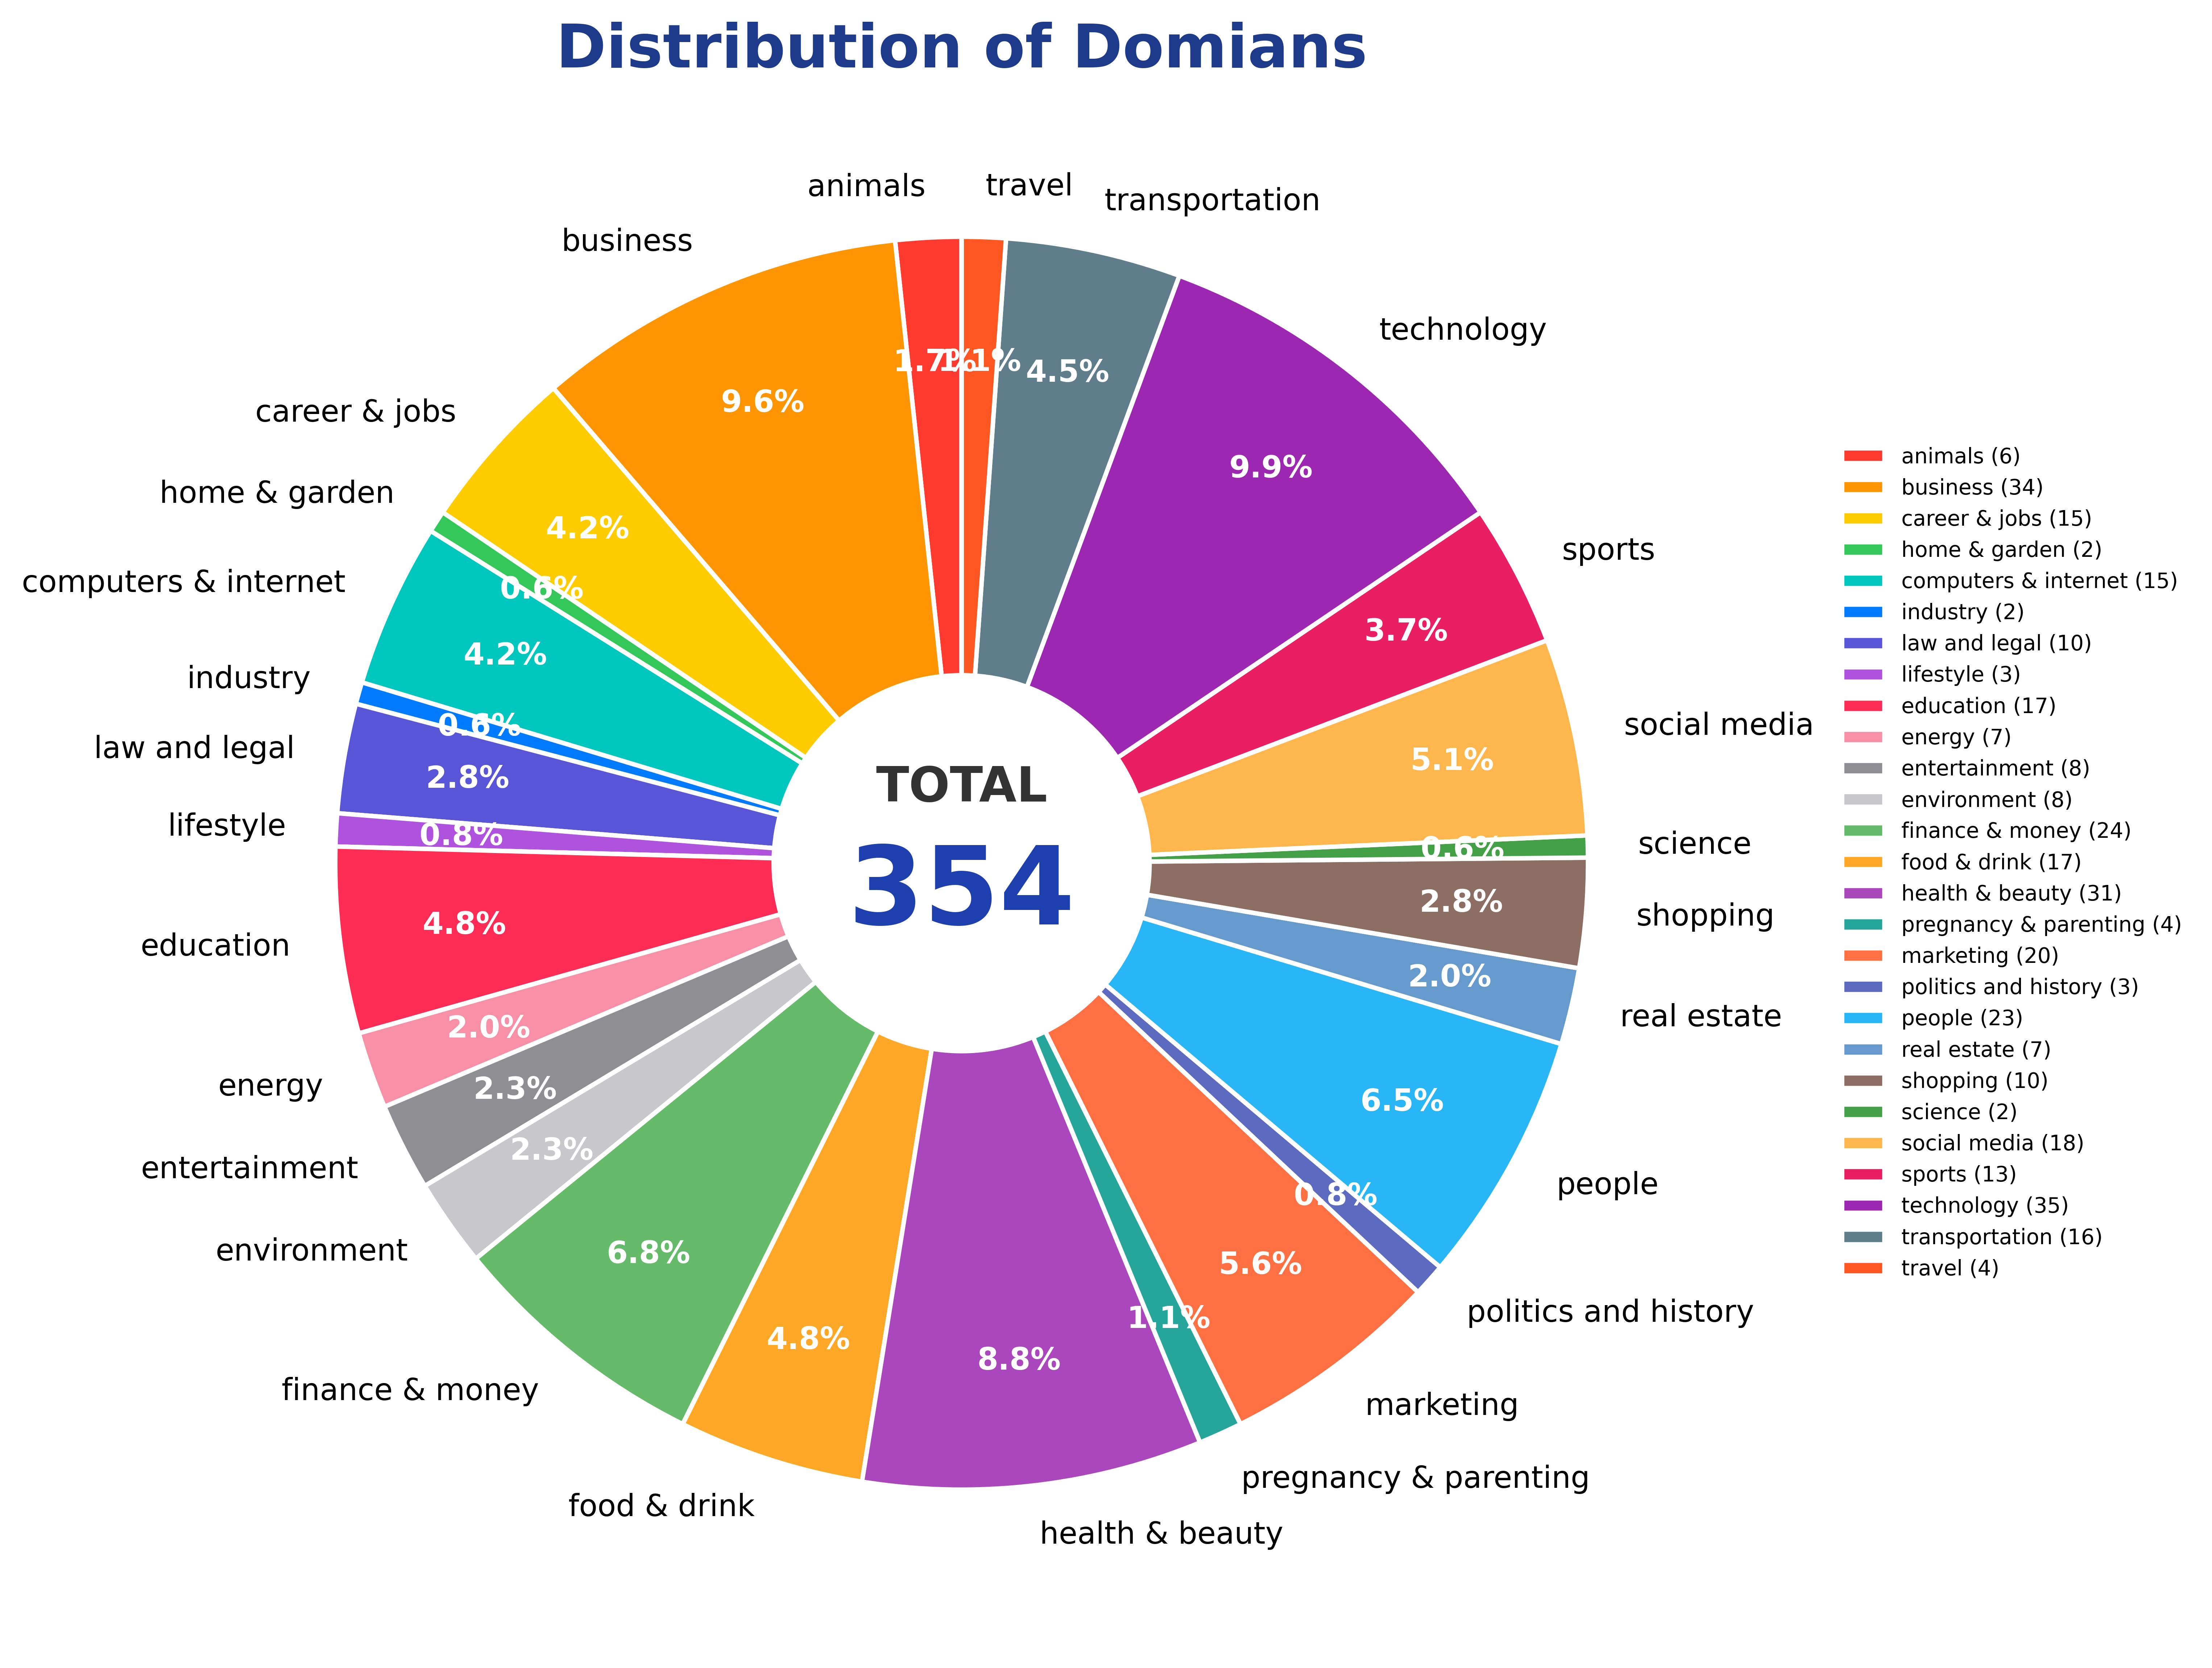
Figure 41-1: Distribution of domain coverage in the Multi-Chart Infographic Reasoning Dataset, spanning 28 fine-grained domains.
Case A.2.3 Chart Types and Layout Features
The dataset contains more than 20 common visualization styles, including bar charts, map charts, tabular charts, card charts, donut charts, pie charts, bubble charts, ranking charts, stacked bar charts, line charts, grouped bar charts, pictogram charts, treemaps, ranking card charts, chord diagrams, tree charts, radial charts, radial bar charts, tile charts, gantt charts, scatter plots, 3d bar charts, and timeline charts.
Each infographic uses whatever mixed layout the original creator used, such as “map + tabular + stacked bar + pictogram” or “pie + ranking card + line.” Different chart types store data differently: tables use rows and columns, maps use geographic regions, pictograms use icon counts, and line charts use temporal sequences. The model must adapt reading rules across formats and then aggregate across them.
Figure 41-2 illustrates the corresponding workflow or structure.
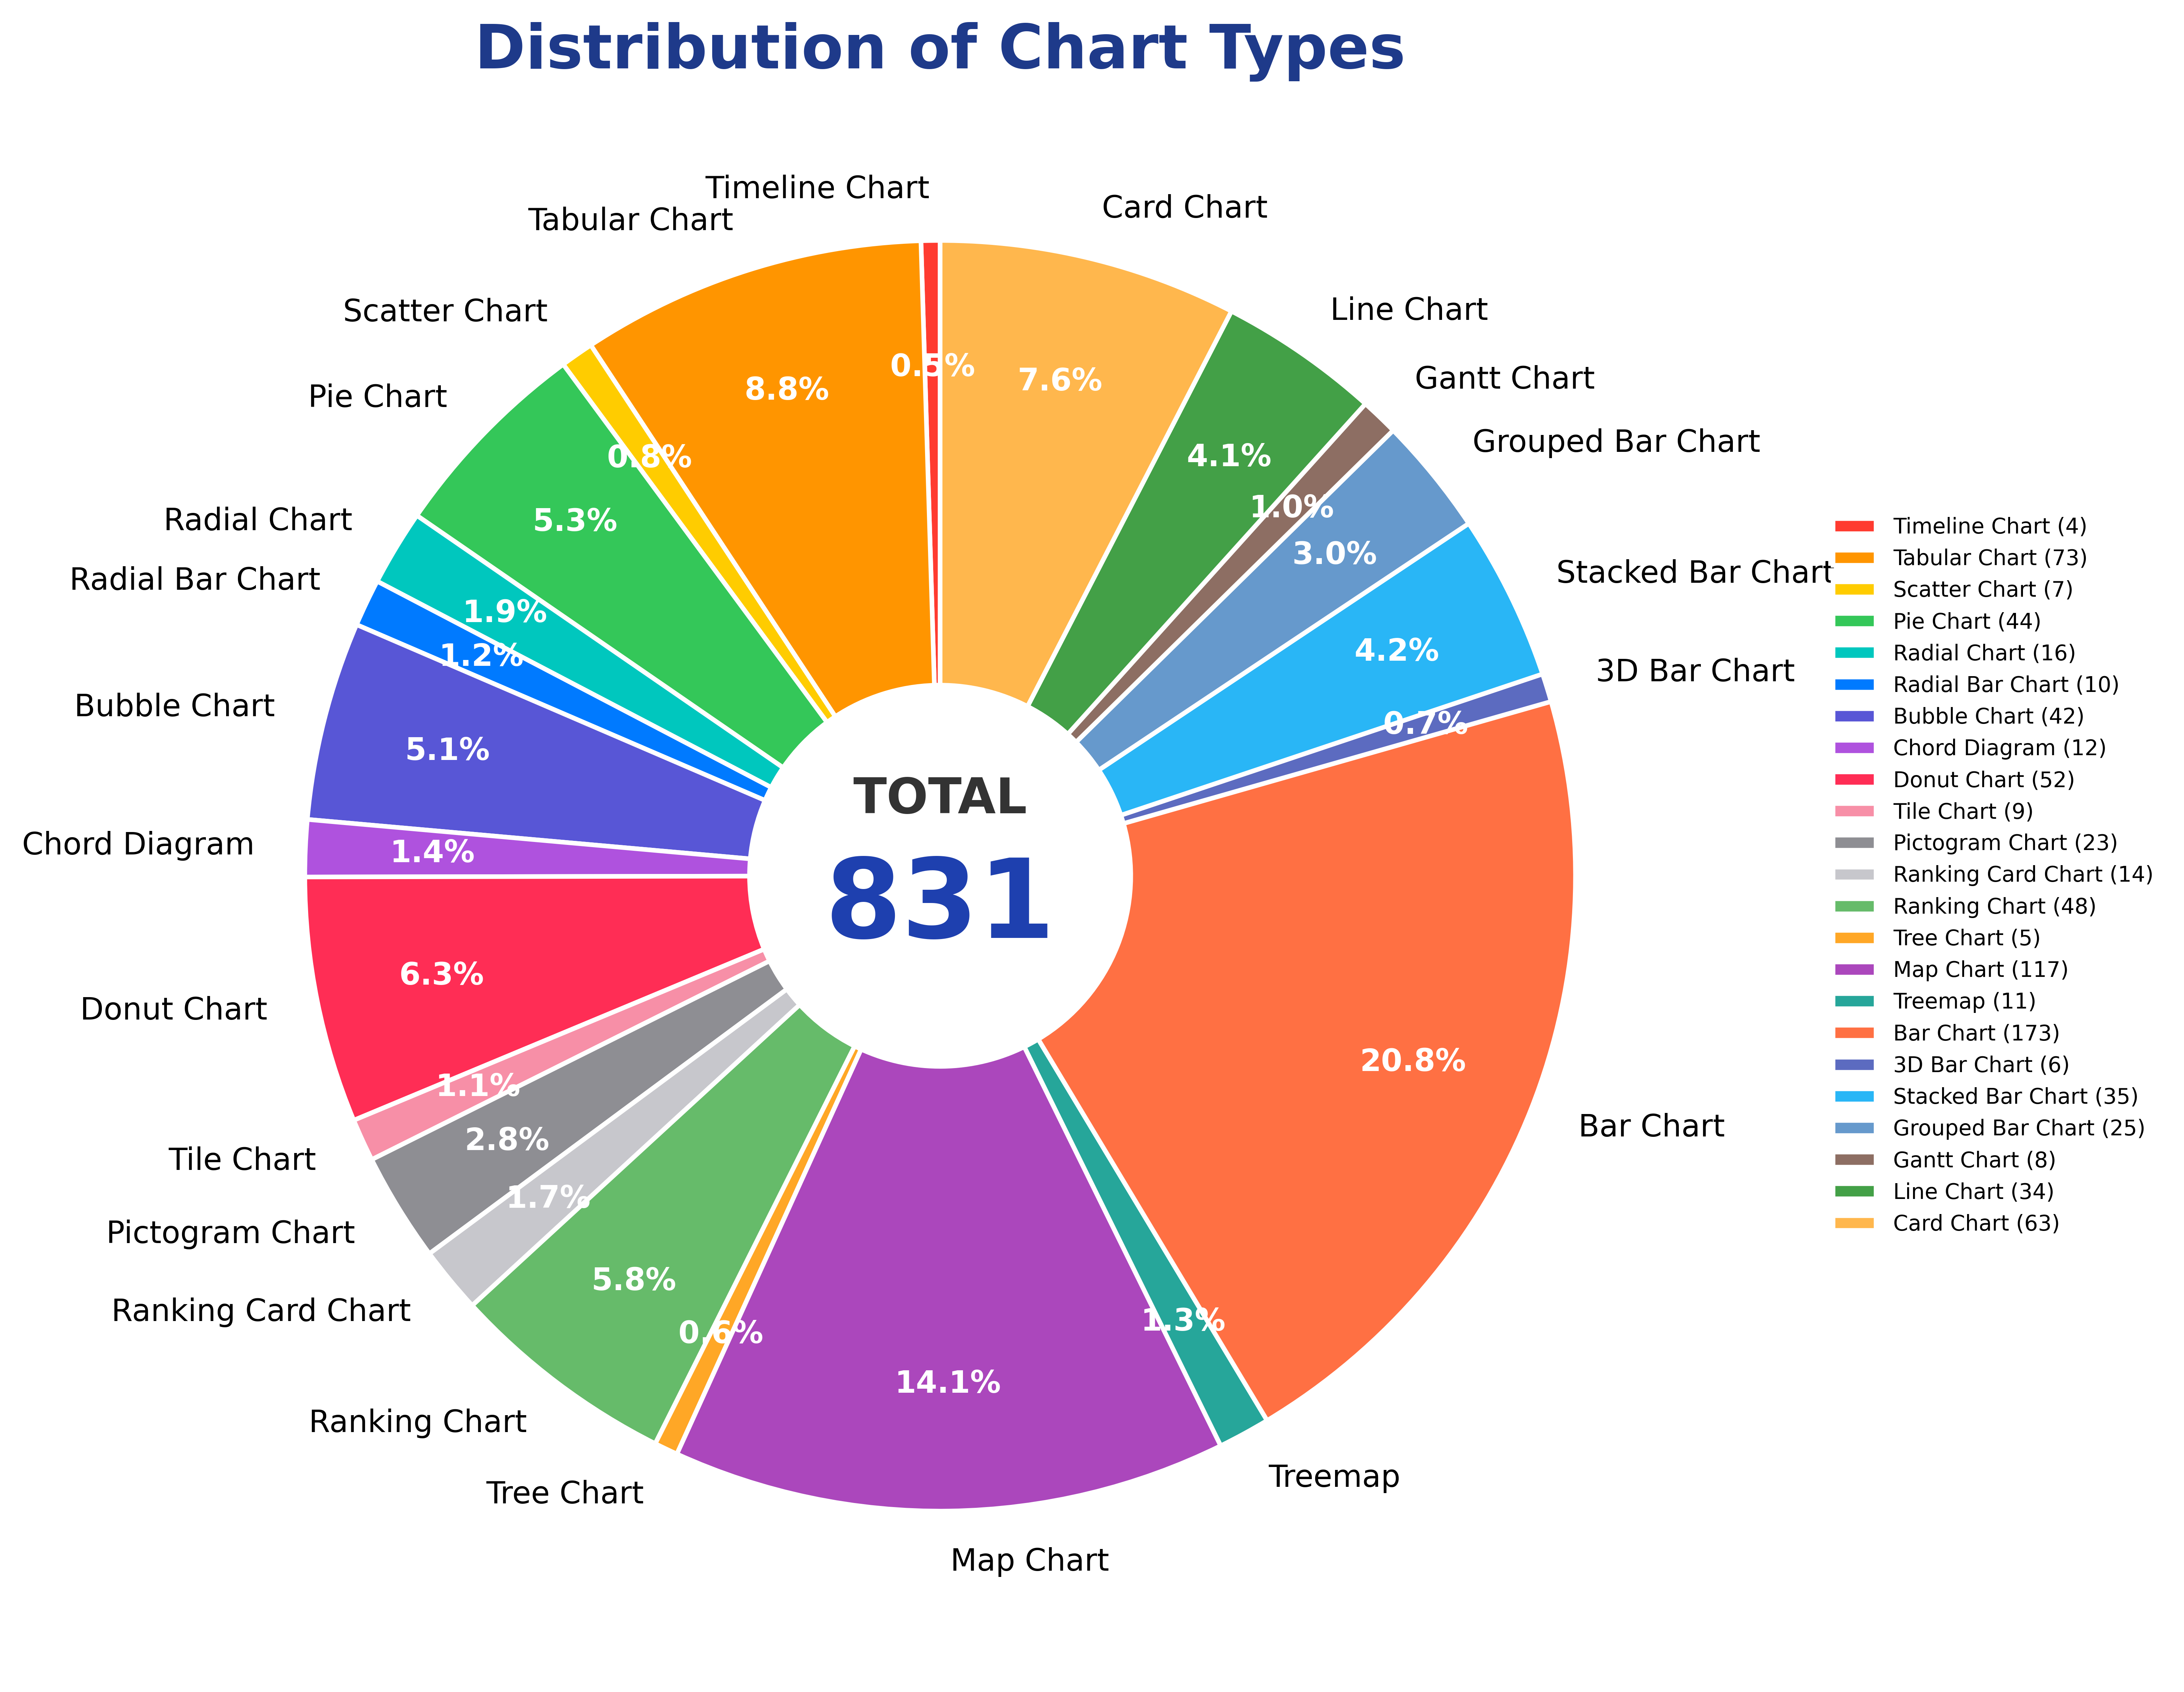
Figure 41-2: Distribution of sub-chart types in the Multi-Chart Infographic Reasoning Dataset, covering 23 distinct chart categories.
Case A.2.4 Question Types
The subquestions are not limited to one extraction style. They cover 17 mainstream reasoning types: value, categorization, sum, average, median, extrema, count, ranking, proportion, trend, difference, anomaly, assuming, visual, condition, calculation, and other.
Questions within one infographic are randomly mixed across types, creating chains such as “maximum lookup + difference calculation + conditional reasoning” or “counting + ratio calculation + visual reasoning.” Extraction questions focus on reading; calculation questions combine multiple values; conditional questions use legends and filters; visual questions use symbols and visual context.
Figure 41-3 illustrates the corresponding workflow or structure.
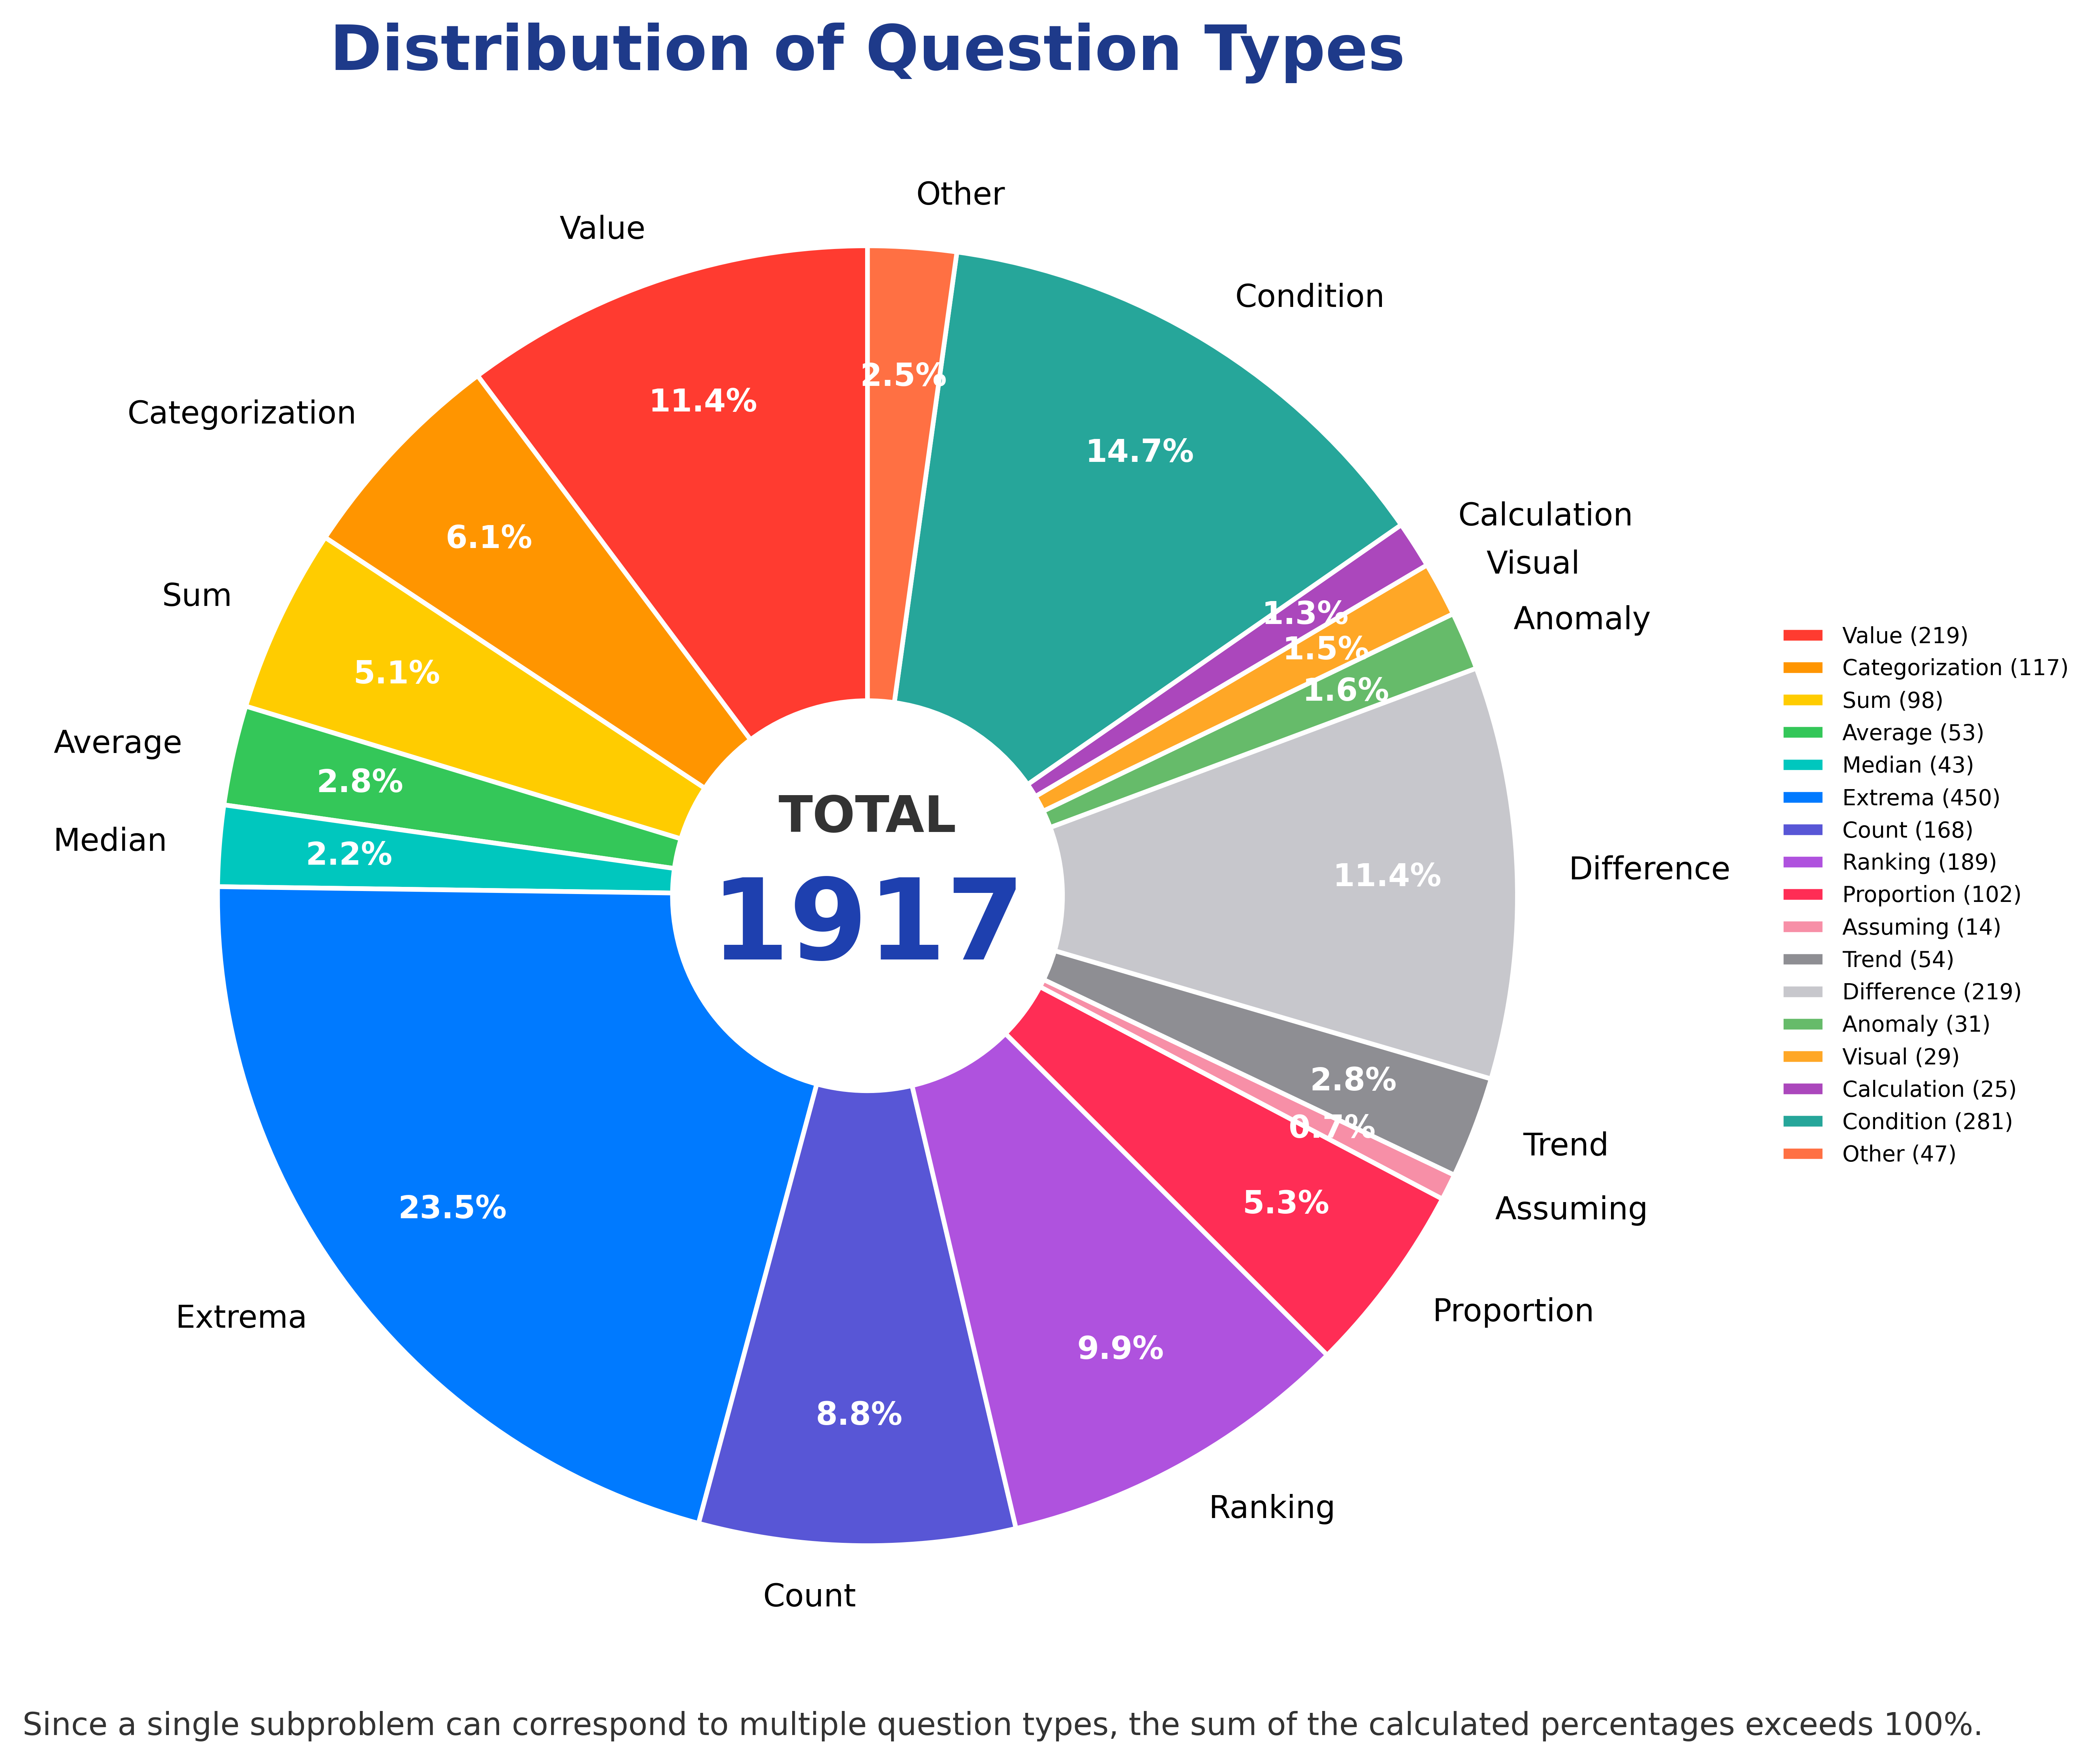
Figure 41-3: Distribution of sub-question types in the Multi-Chart Infographic Reasoning Dataset, comprising 13 question categories.
Case A.2.5 Standardized Core Tasks
Cross-chart data aggregation groups, merges, and summarizes heterogeneous data scattered across subcharts and physical regions. This is the main feature distinguishing the dataset from traditional ChartQA.
Multi-step serial calculation arranges subquestions as dependent chains. Earlier answers are inputs to later calculations, so a final answer cannot be solved in one step.
Visual and contextual reasoning combines legends, icons, annotations, and natural-language side text. In the shark-attack example, the species in a fatal 2018 Massachusetts attack is identified from symbol and text annotations rather than axis values.
Case A.3: Sample Structure: Shark-Attack Example
The dataset's shark-attack example illustrates subchart partitioning, question chain, evidence locations, and reasoning path.
Case A.3.1 Physical Layers of One Compound Infographic

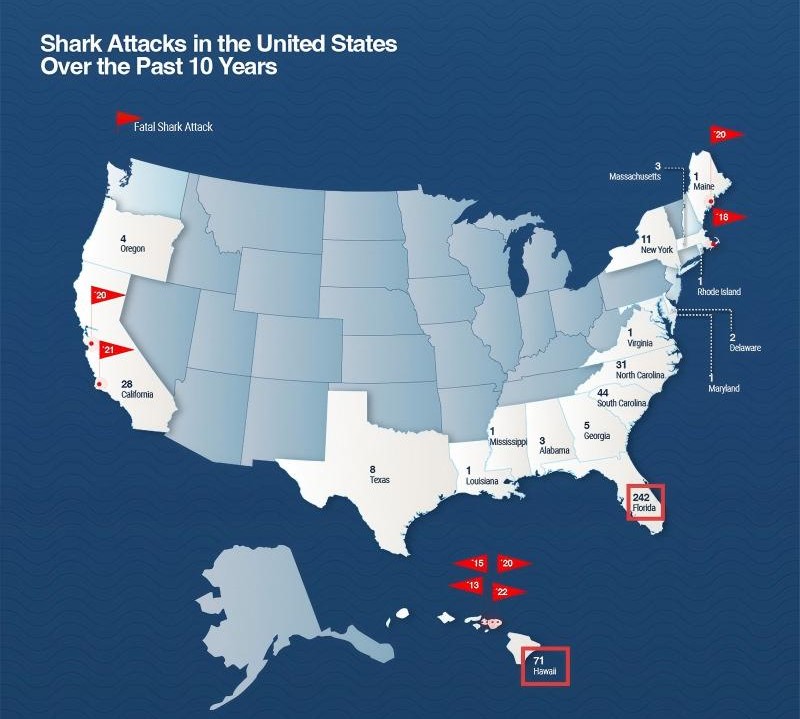
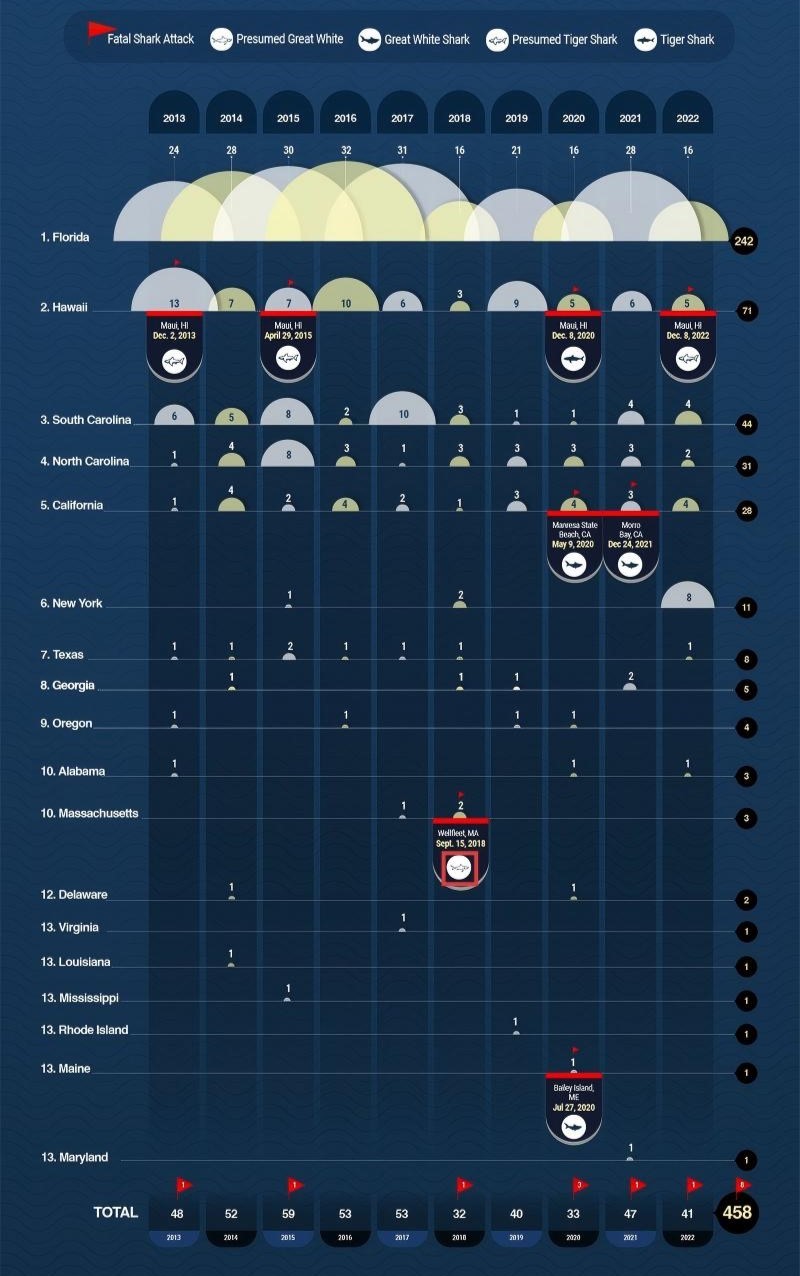
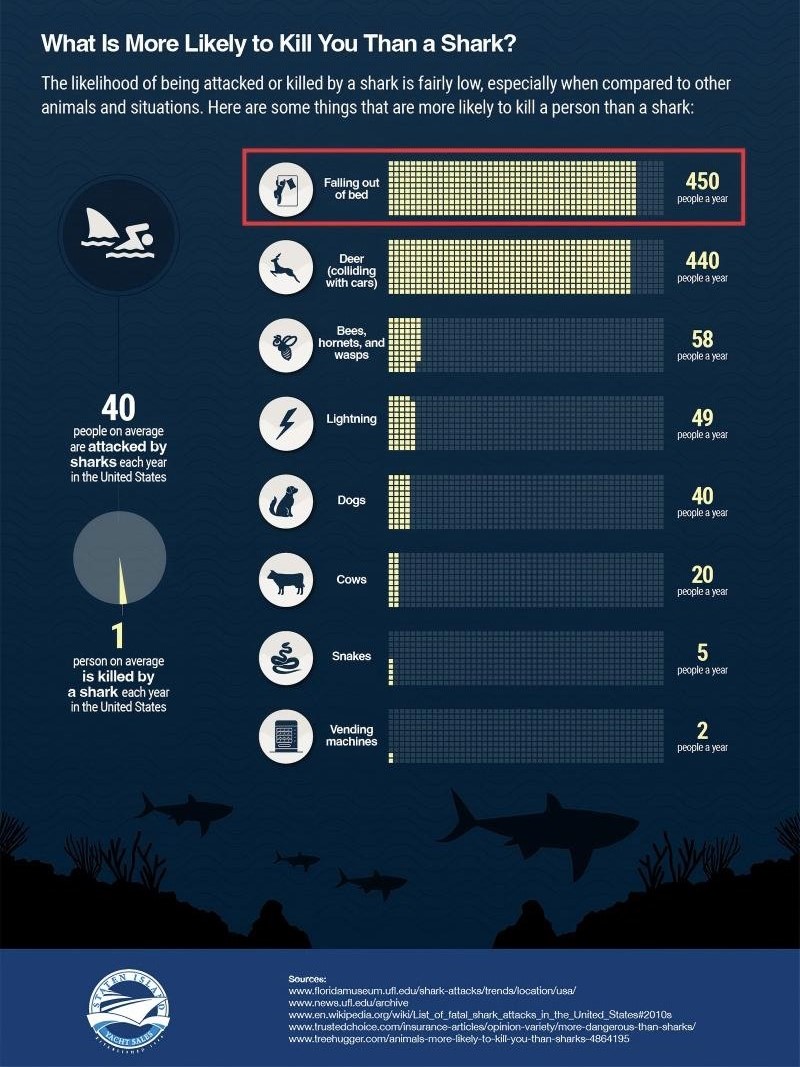
Figure 41-4 illustrates the corresponding workflow or structure.
Figure 41-4: Example of a multi-chart infographic sample from the dataset (Shark Attacks), consisting of four distinct subcharts covering three categories of statistics: historical shark-attack county ranking in the United States, state-level shark attacks in the last ten years, and average annual accidental deaths in the United States. The original figure is vertically elongated and hard to read as a whole; it is thus divided into horizontally aligned subfigures.
The example is one integrated science infographic. Its internal regions belong to different chart types, statistical scopes, and data dimensions, while sharing the page title and side annotations:
- Subchart A: Radial chart. Historical shark-attack county ranking in the United States. Key value: Volusia, Florida has 343 attacks, the county maximum. It supports Q1.
- Subchart B: Map chart. State-level shark attacks in the last ten years. Key values: Florida 242, Hawaii 71. It supports Q2 and Q3.
- Subchart C: Table chart / side annotation. Fatal shark-attack species in Massachusetts in 2018. Key answer: Presumed Great White. It supports Q4.
- Subchart D: Bar chart. Average annual accidental deaths in the United States. Key values: falling from bed 450, cats none. It supports Q5 and Q6.
Case A.3.2 Full Question Chain
Table 41-1 summarizes the corresponding comparison and engineering considerations.
Table 41-1: Case A.3.2 Full Question Chain.
| ID | Type | Question | Answer | Evidence Source | Dependency |
|---|---|---|---|---|---|
| Q1 | Maximum lookup | Which U.S. county has the highest historical shark-attack count? | Volusia, FL | Subchart A | None |
| Q2 | Count | What is the total number of shark attacks over the last ten years in the state containing the county from Q1? | 242 | Subchart B | Uses Q1's Florida keyword |
| Q3 | Difference | How many more shark attacks did Florida have than Hawaii in the last ten years? | 171 | Subchart B: FL=242, HI=71 | Uses Florida value from Q2, then extracts Hawaii |
| Q4 | Conditional reasoning | What species was involved in the fatal Massachusetts shark attack in 2018? | Presumed Great White | Subchart C / notes | Uses symbols and text context |
| Q5 | Count | How many people die each year from falling out of bed? | 450 | Subchart D | Switches evidence source |
| Q6 | Count | How many people die each year from cats? | None | Subchart D | Same local chart |
Q1-Q2-Q3 form a three-step cross-subchart calculation path. Q4 is visual-context reasoning. Q5/Q6 are local extraction from another subchart.
Case A.3.3 Evidence Localization and Reasoning Path
Case A.3.3.1 Cross-Chart Evidence Localization
Evidence localization uses several rules:
- Keyword linkage: Q1 outputs Volusia, Florida; “Florida” becomes a retrieval label for Subchart B.
- Region semantic matching: “fatal,” “2018,” and “Massachusetts” match side timeline annotation rather than numeric charts.
- Topic-region matching: “falling from bed” and “cat deaths” match the accidental-death chart.
Case A.3.3.2 Full Chained Reasoning Path
The full path is: Subchart A county maximum -> extract state keyword -> Subchart B ten-year state data -> extract Hawaii value -> difference calculation; side annotation for Q4; Subchart D for Q5/Q6. The model must segment subcharts, retrieve across views, store numbers, perform arithmetic, and interpret legends.
Case A.3.4 Purpose of Unanswerable Questions
Each infographic includes one question that cannot be answered from the image, such as asking how many accidents each year are caused by cats when the original figure does not provide that information. This tests hallucination suppression and refusal robustness. The goal is to prevent models from fabricating unsupported numbers.
Case A.4: Construction Pipeline
The dataset construction process has four core stages: collecting and filtering real compound infographics, manually partitioning subchart regions, designing layered question chains, and cross-checking answers. No synthetic charts are generated. Large models can help propose questions, but humans verify and revise them.
Figure 41-5 illustrates the corresponding workflow or structure.
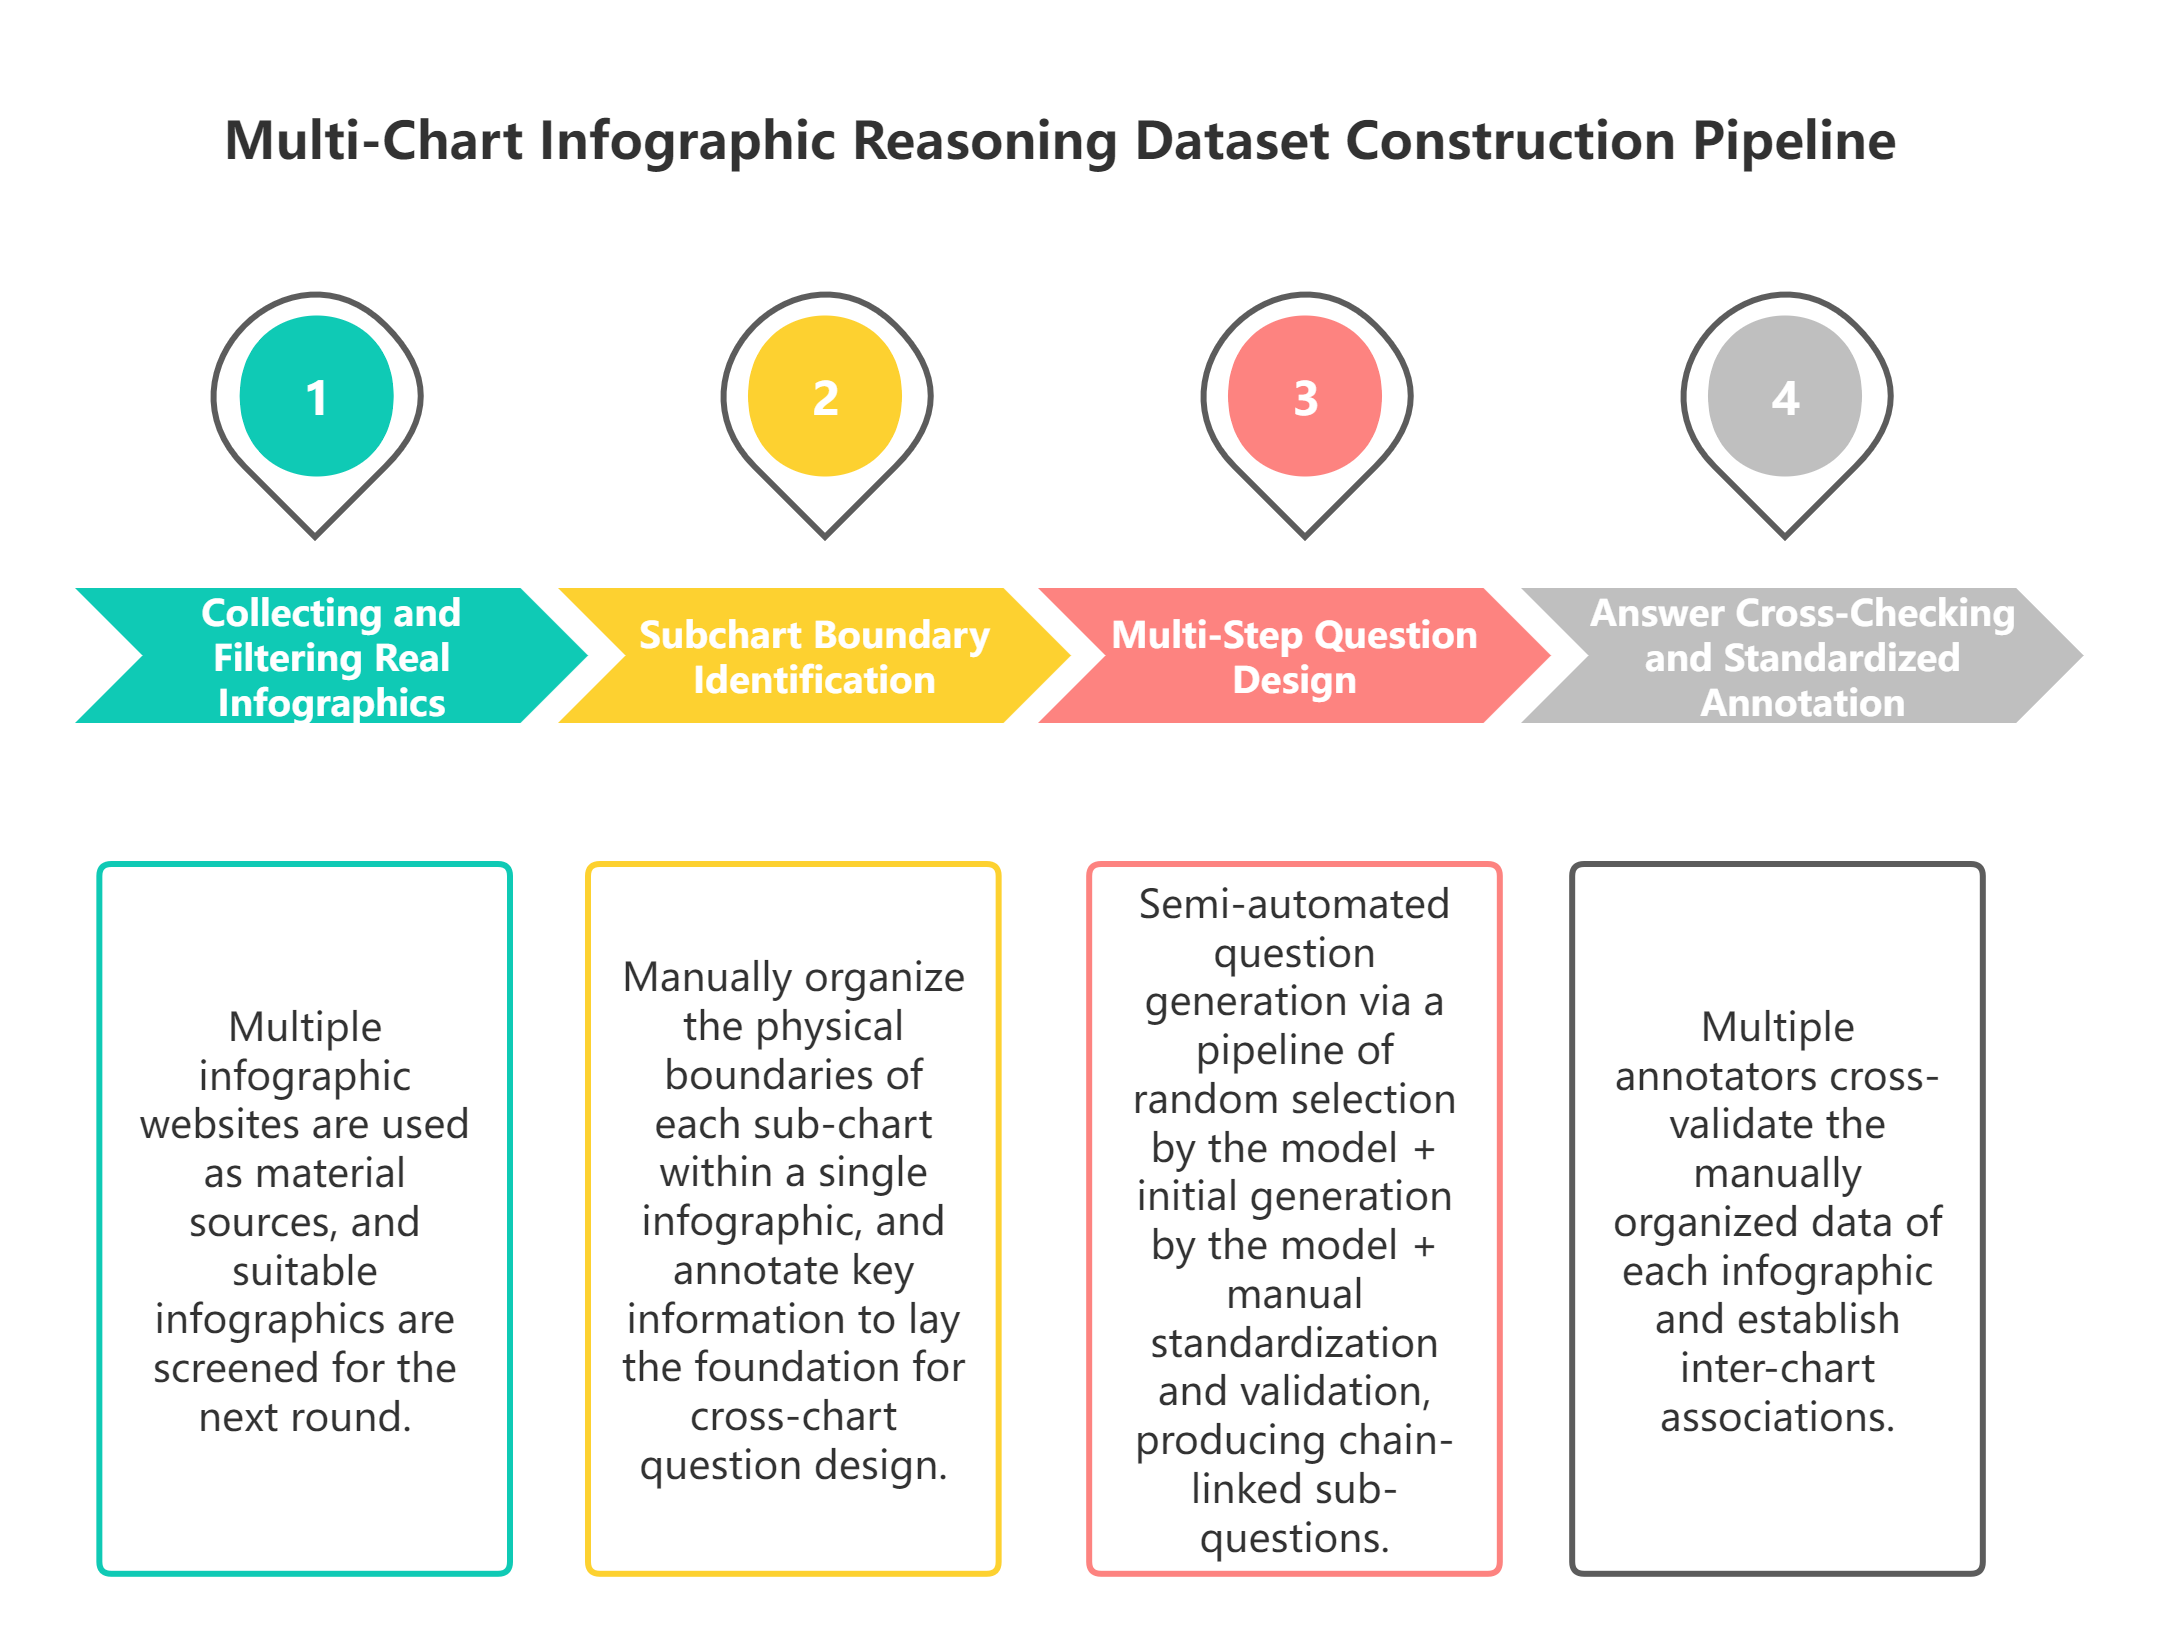
Figure 41-5: Overview of the four-stage data construction pipeline for the Multi-Chart Infographic Reasoning Dataset: collecting and filtering real compound infographics, manually partitioning subchart regions, designing layered question chains, and cross-checking answers.
Case A.4.1 Collecting and Filtering Real Infographics
Sources include real infographic websites such as Bee Infographic, Best Infographics, Centers for Disease Control and Prevention, Cool Infographics, and other infographic websites.
Filtering rules include: the full image contains at least two different chart types; cross-chart statistical relationships exist; legends, annotations, and category labels are complete; low-quality or cropped images are removed; and samples are balanced across the 28 domains. After filtering, 354 valid images enter annotation.
Case A.4.2 Subchart Boundary Identification
Annotators manually mark each subchart's physical boundary, chart type, statistical period, and statistical dimension such as region, time, or category. This step defines data boundaries for later cross-chart questions.
Case A.4.3 Multi-Step Question Design
For each infographic, annotators use a semi-automatic design process of type selection, model drafting, and human refinement. They first randomly select several target question types from the full pool, such as extrema extraction, counting, difference calculation, conditional reasoning, trend analysis, or anomaly judgment. A large model then drafts chained candidate questions constrained by those types and by the subchart structure. Human annotators revise the draft against the original image, legends, and region data: they refine natural language, fix cross-chart logic holes, remove invalid or unsupported questions, and recalculate standard answers by reading the image. After this iterative process, the final dataset contains 1,917 valid subquestions and one unanswerable question per image.
Case A.4.4 Answer Cross-Checking and Standardized Annotation
A two-person cross-check is used. Annotator A designs questions and answers. Annotator B independently reads the image and recalculates answers. Calculation errors and legend misreads are corrected. Answer format is standardized: numerical answers use Arabic numerals, and text answers normalize proper names and abbreviations.
Case A.5: Evaluation Protocol
Unlike traditional ChartQA, which often uses answer-string accuracy, this dataset needs layered metrics for chained reasoning.
Case A.5.1 Independent Single-Step Accuracy
This metric ignores dependencies and checks each subquestion independently. It measures basic reading and calculation ability. Its limitation is that it cannot reveal chain coherence.
Case A.5.2 Full-Chain Accuracy
For a dependent question chain, all subquestions must be correct for the chain to count as correct. Any earlier error fails the whole chain. This is the core metric because it measures multi-step reasoning and cross-chart linkage stability. If Q1 identifies the wrong county, Q2 and Q3 fail as a reasoning chain even if their formulas are correct.
Case A.5.3 Cross-Chart Evidence Localization Accuracy
This metric checks whether the model locates the correct subchart or legend region for the answer. If the answer should use Subchart A and B but the model retrieves from Subchart C, evidence localization fails. It directly measures cross-chart aggregation.
This metric is designed specifically for the cross-chart aggregation task. It evaluates subchart segmentation and cross-chart retrieval rather than only answer strings.
Case A.6: Evaluation Difficulty and Failure Modes
Case A.6.1 Technical Difficulties
- Legend ambiguity: global legends may be shared, icons may replace text explanations, and the same icon may shift meaning across subcharts, so context is needed to interpret symbols.
- Cross-subchart filtering: the same region names or category terms can appear in different subcharts and must be matched precisely; otherwise, data from different partitions is easily confused.
- Statistical-scope confusion: historical totals, last-ten-year counts, and annual averages must not be mixed. Ignoring statistical period is a high-frequency error.
- Error propagation: if an early step in a chained question is wrong, all later calculations can fail as the error propagates through the reasoning path.
- Unanswerable robustness: large models may fabricate answers when the image lacks evidence, making it difficult to identify the correct "cannot answer" scenario.
Case A.6.2 Typical Model Failures
- Misreading fatal versus nonfatal attack icons and therefore failing to infer the shark species in Q4.
- Confusing subchart partitions, such as using accidental-death data from another chart for shark-attack calculations.
- Mixing historical cumulative counts with last-ten-year counts.
- Propagating an early wrong maximum, such as choosing a Hawaii county as the extreme value in Q1 and causing Q2/Q3 to fail.
- Hallucinating a number for an unanswerable question that lacks image evidence.
Case A.7: Current Limits and Future Iteration
The project currently has annotations but no released baseline algorithm or trained benchmark model.
Case A.7.1 Current Limits
- Small sample size: high-quality native compound infographics are scarce, so 354 source images are not enough for large-scale pretraining.
- No baseline algorithm: there is no public cross-chart reasoning SOTA for direct comparison.
- Native imperfections: some web-native images contain blurry handwriting, inconsistent abbreviations, or other real-source defects.
Case A.7.2 Future Directions
- Expand source images and subquestions from authoritative publications across domains.
- Develop baseline cross-chart multi-step reasoning models.
- Add higher-order questions such as ratio conversion, nested multi-condition filtering, and unit conversion.
Case A: Summary
The multi-chart infographic reasoning dataset starts from real compound infographics and breaks away from the single-chart QA paradigm. It reconstructs chart VQA evaluation around cross-chart aggregation, serial calculation, and visual-context reasoning. The structure of 354 multi-subchart images and 1,917 chained subquestions, together with layered evaluation metrics, reflects how people actually read compound data visualizations. The shark-attack example shows that real infographic reasoning requires region-specific evidence retrieval, stepwise calculation, and symbol interpretation. Although the dataset currently lacks companion baselines, it fills an important benchmark gap and can become a standardized evaluation base for future cross-modal chart reasoning, helping chart QA move from laboratory-style synthetic data toward real industrial scenarios.
Case B: MedImage-ToolVQA: Medical Image Local Evidence and Tool-Call Trajectories
MedImage-ToolVQA is implemented with the MindSpore stack. Project URL: https://github.com/blackkiring/MedImage-ToolVQA-Mindspore.
Case B: Learning Objectives
After studying this case, readers should be able to:
- Explain how medical image VQA differs from ordinary VQA in evidence scale, professional semantics, safety boundaries, and evaluation objects.
- Understand why medical image QA should be extended from answer supervision to tool-behavior supervision, and why this matters for auditability and reinforcement-learning interfaces.
- Describe the sample structure built from BiomedParse region-level information, including original images, ROI, masks, bounding boxes, target descriptions, and tool observations.
- Distinguish the boundaries of tools such as zoom-in and segmentation, and explain how tool calls, parameters, and observations become multi-turn training trajectories.
- Assess noise introduced by tool trajectories and design quality-control and human-review rules under medical privacy, compliance, and safety constraints.
Case B.1: Medical Image VQA vs. Ordinary VQA
Ordinary VQA questions ask things like how many people are in the image, what object is on the table, or what color a car is. These questions may be difficult, but they usually rely on object recognition, spatial relations, and commonsense reasoning. Medical image VQA is different. Key evidence may appear as gray-level change, fuzzy boundary, texture shift, local density difference, or abnormal proportion. The challenge is not only recognizing an object, but judging whether limited local evidence supports an option.
The first difference is evidence scale. Important medical regions may be tiny: lung nodules, retinal microbleeds, local nuclear atypia, and small lesions may occupy only a few image patches. If the model answers from a compressed whole-image representation, it may miss them.
The second difference is professional context. A bright spot may be calcification or artifact. A blurry region may suggest inflammation or image-quality issues. Interpreting it requires anatomy, modality, and question context.
The third difference is safety boundary. Ordinary VQA mistakes are usually inaccurate descriptions. Medical image mistakes may be misunderstood as diagnostic judgments. Even research samples must be framed as training and evaluation, not patient advice.
The fourth difference is evaluation target. Ordinary VQA often checks only the final answer. Medical tool-use data must also evaluate whether the evidence-gathering process is reasonable. A model may answer correctly while calling a tool on an irrelevant region; or it may choose a good region but select the wrong final option. Data engineering should record these signals separately.
These differences show that medical image VQA needs a finer data organization than ordinary VQA. It needs to preserve the relationships among the whole image, local regions, tool observations, questions, answers, and behavior trajectories. Only then can model training move from "answering in language" toward "gathering evidence visually."
Case B.2: From Answer Supervision to Tool Behavior Supervision
Traditional VQA supervision is simple: given image and question, output answer. The reasoning process is hidden inside the model. For medical images, that opacity is risky because we do not know whether the model looked at the relevant region or used local evidence.
Tool behavior supervision makes executable behavior nodes part of the sample. For example, the model decides that local zoom is needed, calls Zoom-in, receives a local crop, and then continues the answer. The supervision now includes tool selection, parameter generation, observation consumption, and final answer.
This has three benefits. First, it teaches a workflow closer to medical image review, where local reinspection and boundary confirmation are common. Second, it improves auditability: tool parameters, observation images, and answers can be checked. Third, it provides an interface for later reinforcement learning because tool calls and observations can be structured as environment actions and feedback.
Tool behavior supervision is not a cure-all. It introduces new data noise: tools may segment incorrectly, bboxes may drift away from the target, and models may over-call tools to satisfy the format. Data engineering must acknowledge these risks and reduce their impact through validation and review. The goal is not to create more complex-looking samples. Each tool action should explain what visual uncertainty it resolves.
The basic idea of MedImage-ToolVQA can therefore be summarized as follows: transform the implicit local-evidence process in medical image QA into trainable, checkable, and evaluable multi-turn samples. It keeps answer supervision but does not stop there; it introduces tool trajectories but does not treat tool calls as decoration.
Case B.3: Data Objects and Scale
MedImage-ToolVQA targets medical image multiple-choice QA. Samples are built on region-level information from BiomedParse (Zhao et al. 2025), including original image, target region, mask, bbox, target description, question, candidate options, correct answer, and local observation images returned by tools. The final training data has 24,992 records.
Table 41-2 summarizes the corresponding comparison and engineering considerations.
Table 41-2: Case B.3: Data Objects and Scale.
| Metric | Value | Data-Engineering Meaning |
|---|---|---|
| Total records | 24,992 | Medical image tool-use samples for training and evaluation |
| Region source | BiomedParse | ROI, mask, bbox, and target description organize local evidence |
| Question form | Multiple-choice medical image VQA | Supports answer checks and rule rewards |
raw_images = 3 |
19,945 | Most common tool-enhanced trajectory form |
raw_images = 1 |
2,471 | Direct visual reasoning or single-image samples |
raw_images = 4 |
1,383 | Additional tool observation or multi-step trajectory |
raw_images = 2 |
1,193 | Original image plus one tool observation |
| Answer A | 9,986 | Option distribution requires bias checks |
| Answer B | 7,177 | Option distribution requires bias checks |
| Answer C | 5,473 | Option distribution requires bias checks |
| Answer D/E | 2,356 | Long-tail options should not be hidden by aggregate accuracy |
This is not merely a scale table. It highlights option imbalance, the importance of multi-image tool observations, and the dependence of sample quality on ROI, mask, and bbox reliability.
MedImage-ToolVQA sits between a VQA dataset and an agent trajectory dataset. It still has image, question, and answer, but it also records tool actions and observations.
Case B.4: ROI, Mask, and Bbox as Local Evidence
The first step is to make local evidence operational. Natural language can say “a small nodule near the pleura in the right upper lung,” but tools need an interface. ROI, mask, bbox, and target description provide that interface.
ROI is the region of interest. Bbox gives a rectangular boundary, suitable for cropping and coarse localization. Mask gives pixel-level shape, suitable for segmentation, overlay, and boundary review. Target description maps the region to medical semantics such as lung nodule, liver lesion, vascular structure, or local pathology abnormality.
If only bbox exists, the data can zoom but may not express fine boundary. If only mask exists, it can express shape but may be hard for models to generate as a tool parameter. If only description exists, the model knows the semantic target but cannot verify position. Tool-use data should therefore keep bbox, mask, and description together.
ROI also prevents questions from becoming pure text medical QA. “What organ do lung nodules usually appear in?” is not a valid image question. “Which option best describes the boundary and density of the local abnormality in the image?” requires visual evidence.
At the same time, local evidence can create localization leakage. If the question says “the boxed region” or “inside the mask,” the model does not learn active localization. Good questions imply the need for local observation without exposing bbox or mask.
In this sense, local evidence is both a training resource and a constraint. It helps construct samples and also helps filter them. A qualified MedImage-ToolVQA sample should make the relationship between question and ROI clear without leaking the ROI annotation mechanism in the prompt; it should allow the tool trajectory to use bbox or mask without treating those annotations as answers already given in the question.
Case B.4.1 Question and Option Design
A good medical image VQA question should satisfy three conditions: it is tied to a concrete image region, it does not leak annotation position, and its options differ by observable visual evidence.
The first condition is region relevance. The question should not be general medical knowledge or a broad modality/organ label. For example, "what are common imaging signs of lung nodules" is closer to knowledge QA, while "which option better describes the boundary and density of the target region in the image" is closer to image QA. The former trains medical knowledge recall; the latter trains visual-evidence judgment.
The second condition is avoiding localization leakage. Builders have bbox and mask, so it is tempting to write prompts such as "the boxed region" or "the annotated area." Such wording looks clear but undermines the goal of tool-use data: the model is already told where to look, so the later tool call merely follows the prompt rather than deciding from the question and whole image. Better questions point naturally to a medical phenomenon rather than to the annotation mechanism.
The third condition is option separability. Options should not be synonyms and should not all depend on external medical knowledge. They should differ by observable visual features, such as boundary clarity, focal versus diffuse distribution, density or signal abnormality, artifact versus true structure, and similar visual cues. Only then does the model need image evidence to eliminate options.
A healthy difficulty mix should include whole-image answerable samples, samples requiring local zoom, and samples requiring segmentation or boundary confirmation. If every question is too simple, the model tends to answer directly; if every question is too hard, trajectories may become too long and unstable. The point of the mix is to teach the condition for tool use, not a fixed format.
Medical questions should also avoid asking for clinical treatment or diagnosis. Multiple-choice answers can select the option that best matches image appearance, but explanations should not expand into patient advice.
Question and option design is therefore the first quality gate in MedImage-ToolVQA. It determines whether a sample deserves to enter later trajectory synthesis. If the question itself lacks image dependency, even a refined tool trajectory is only formal complexity. If the question is well designed, the tool trajectory can become real behavior supervision.
Case B.4.2 Observation Image Lifecycle
Observation images are not ordinary illustrations. They are derived from the original image and returned to the model as new inputs.
- Generation: local crop from bbox, mask overlay from segmentation, or semantic segmentation image from tool output. Observation images should not merely look good; they should be useful as evidence. They need to preserve enough local detail while avoiding the amplification of irrelevant background into misleading information.
- Binding: returned images must be tied to original image, tool parameters, and dialogue turn. If image indices are unstable, the model may confuse one tool return for another. If the bbox-observation relationship is not recorded, later audit cannot determine whether the tool looked at the intended region.
- Consumption: later answers should reflect the observation, not ignore it. The model should confirm or revise its judgment from the observation, rather than continue answering only from the original image and prompt.
- Audit: derived images need de-identification, quality checks, and version records. Local crops may enlarge corner labels or IDs; mask overlays may affect human judgment through color or opacity; segmentation images may cover adjacent structures incorrectly.
Observation images are both training inputs and audit objects. Without maintaining this relationship, multi-image trajectories become “one original image plus some extra pictures” rather than evidence paths.
Case B.5: Conceptual Construction Flow
MedImage-ToolVQA construction has six stages: region sample organization, question generation, quality verification, tool observation generation, trajectory synthesis, and training packaging. The following example rewrites the former pseudocode as MindSpore-oriented implementation entries. It uses MindRecord for durable sample storage, mindspore.dataset for training input, and vllm-mindspore for LLM serving during question and trajectory generation. The official vllm-mindspore codebase is hosted on AtomGit at https://atomgit.com/mindspore/vllm-mindspore. The example leaves project-specific de-identification rules and error handling to the repository implementation, but keeps the data contracts and quality gates explicit.
Case B.5.1 Region Merging: Write Evidence into MindRecord
merge converts region evidence from different parsing tools or intermediate results into a MindSpore-readable data asset. The example keeps only the core contract: deduplicate by image_id and region_id, preserve bbox, mask, target description, and source fields, and write the result into MindRecord.
Listing 41-1 provides a Python implementation excerpt.
from mindspore.mindrecord import FileWriter

schema = {
    "image_id": {"type": "string"},
    "region_id": {"type": "string"},
    "bbox": {"type": "int32", "shape": [-1]},
    "mask_path": {"type": "string"},
    "target_desc": {"type": "string"},
    "source": {"type": "string"},
}

writer = FileWriter("region_pool.mindrecord", shard_num=4, overwrite=True)
writer.add_schema(schema, "region evidence schema")
writer.write_raw_data(deduplicate_regions(raw_regions, keys=["image_id", "region_id"]))
writer.commit()
Listing 41-1: Python implementation excerpt.
Case B.5.2 LLM Serving: Use vllm-mindspore
make_vqa and makereasoning call a locally deployed LLM. In the MindSpore stack, vllm-mindspore can expose an OpenAI-compatible service. Its official codebase is hosted on AtomGit at https://atomgit.com/mindspore/vllm-mindspore.
Listing 41-2 provides a command-line run example.
Listing 41-2: Command-line run example.
Listing 41-3 provides a Python implementation excerpt.
Listing 41-3: Python implementation excerpt.
Case B.5.3 Question Generation: Read Region Evidence from MindDataset
make_vqa reads region evidence from MindDataset and generates the question, candidate options, and reference answer. The prompt hides bbox, mask paths, and region IDs to avoid leaking annotation mechanics into the question.
Listing 41-4 provides a Python implementation excerpt.
import mindspore.dataset as ds

dataset = ds.MindDataset("region_pool.mindrecord", shuffle=False)

for row in dataset.create_dict_iterator(output_numpy=True):
    prompt = build_vqa_prompt(row, hide_fields=["bbox", "mask_path", "region_id"])
    reply = client.chat.completions.create(
        model="Qwen/Qwen3-vl-8B",
        messages=[{"role": "user", "content": prompt}],
        temperature=0.2,
    )
    write_jsonl("vqa_candidates.jsonl", parse_vqa(reply.choices[0].message.content, row))
Listing 41-4: Python implementation excerpt.
Case B.5.4 Quality Verification: Produce Gate Results
verify does not rewrite the answer directly. It attaches quality-gate results to each sample. Only samples with complete fields, clear image dependency, region consistency, and valid tool JSON move into trajectory synthesis.
Listing 41-5 provides a Python implementation excerpt.
gates = {
    "complete": has_required_fields(sample),
    "image_dependent": requires_visual_evidence(sample),
    "region_consistent": align_question_answer_roi(sample),
    "tool_json_valid": validate_tool_schema(sample),
}

sample["review_status"] = "pass" if all(gates.values()) else "revise"
sample["quality_gates"] = gates
Listing 41-5: Python implementation excerpt.
Case B.5.5 Trajectory Synthesis: Return Tool Observations to Dialogue
makereasoning is not about generating longer explanations. Its core task is to place tool calls and returned observation images into the next dialogue turn. If local evidence is unnecessary, the sample keeps a direct visual reasoning path.
Listing 41-6 provides a Python implementation excerpt.
observation = run_visual_tool(sample) if needs_local_evidence(sample) else None
prompt = build_reasoning_prompt(sample, observation)
reply = client.chat.completions.create(
    model="Qwen/Qwen3-vl-8B",
    messages=[{"role": "user", "content": prompt}],
    temperature=0.1,
)

sample["trajectory"] = build_tool_trajectory(sample, observation, reply)
Listing 41-6: Python implementation excerpt.
Case B.5.6 SFT Packaging: Store Training Records in MindRecord
make_sft writes multi-turn messages, image references, answers, and quality labels into a training MindRecord. The SFT side then loads it through mindspore.dataset.MindDataset and batches it for fine-tuning.
Listing 41-7 provides a Python implementation excerpt.
schema = {
    "messages": {"type": "string"},
    "images": {"type": "string"},
    "answer": {"type": "string"},
    "quality": {"type": "string"},
}

writer = FileWriter("tool_sft.mindrecord", shard_num=8, overwrite=True)
writer.add_schema(schema, "tool-use SFT schema")
writer.write_raw_data(pack_sft_records(tool_trajectories))
writer.commit()

train_ds = ds.MindDataset("tool_sft.mindrecord").shuffle(4096).batch(8)
Listing 41-7: Python implementation excerpt.
Figure 41-6 illustrates the corresponding workflow or structure.

Figure 41-6: Conceptual construction flow for MedImage-ToolVQA. The key point is not script order, but how the evidence chain and behavior chain are preserved across stages.
The first stage is region-sample organization. Region-level results from medical image parsing tools need to be merged, deduplicated, and normalized. A single medical image may contain multiple candidate regions, and the same region may appear repeatedly in different intermediate results. Data engineering should deduplicate by region identifier rather than simply by image identifier; otherwise, multiple findings or structures in the same image may be mistakenly removed.
The second stage is question generation. The builder generates medical multiple-choice questions from the original image, target region, mask, bbox, and target description. Questions should read like ordinary medical image VQA questions and should not expose annotation mechanics such as "inside the box" or "in the mask." Candidate options need to distinguish local visual features, rather than merely list generic medical concepts.
The third stage is quality verification. The system checks question structure, option quality, answer consistency, and region grounding. Here, grounding does not only mean whether a detection box is accurate in the traditional sense, but whether the question, answer, and target region have a reasonable relationship. If a question is unrelated to the ROI, it is unsuitable as a tool-use training sample even when the textual answer is correct. This stage also identifies questions that can be answered without looking at the image, preventing samples from degenerating into pure-text medical QA.
The fourth stage is tool-observation generation. For samples that need tool enhancement, the construction flow generates local crops, mask overlays, or segmentation observation images. These images are not decoration; they become new inputs in the later multi-turn trajectory. During training, the model sees an observation image appear after a tool call and learns how to consume the tool return.
The fifth stage is trajectory synthesis. Verified samples are organized into a multi-turn structure: the model first observes the original image and question, decides whether to call a tool, receives the tool observation, then continues reasoning and outputs the answer. About 90% of samples use a tool-enhanced path, while about 10% are kept as direct visual reasoning samples. Keeping direct samples is necessary because not every question should call a tool. If the training data implies that every question requires tool use, the model will learn an inefficient or even incorrect behavior policy.
The sixth stage is training packaging. Trajectories are arranged as SFT dialogue records and RL-ready environment inputs. SFT emphasizes format and demonstration, while RL emphasizes policy optimization and reward feedback. They can use similar sample foundations, but their training objectives and packaging formats differ. Training packaging is not simple text concatenation; assistant-side tool calls, user-side observation images, and final answers must be separated into trainable multi-turn records.
The most important principle in this flow is that evidence must not be lost. Which image the question came from, which region it corresponds to, how the tool observation was generated, and how the answer was verified all need to remain traceable. Otherwise, the final data may appear to contain tool calls while providing no proof that those tool actions are related to medical image evidence.
Case B.6: Three Tools and Their Boundaries
MedImage-ToolVQA uses three visual tools: Zoom-in, BiomedParse, and SAM2. They correspond to three common needs in medical image analysis: looking more closely, locating by medical semantics, and obtaining finer segmentation from a geometric prompt.
Zoom-in is the most intuitive tool. It crops a local region according to a bbox so the model can obtain a higher-resolution local observation. It is suitable for small regions whose details are insufficient in the full image. For example, a small lung nodule may occupy only a tiny portion of the whole image, and its boundary and density can be observed more clearly after zooming in. Its risk is also direct: if the bbox drifts, the crop may miss key evidence; if the crop is too tight, it may lose surrounding anatomical context.
BiomedParse is closer to medical semantic segmentation. It accepts a target image and a textual description such as "lung nodule" or "liver lesion" and returns segmentation results related to the medical semantic target. This tool can connect natural-language targets with medical image regions, making it suitable for semantic localization. Its risk is that medical imaging modalities vary widely: if the text description is inaccurate, the tool may return the wrong region or segment a similar structure as the target.
SAM2 is a general bbox-prompted segmentation tool (Ravi et al. 2025). It does not rely on medical semantics; instead, it generates a finer mask from a geometric prompt. For samples that already have a candidate box but need a clearer boundary, SAM2 can provide supplementary observation. Its main risk is strong dependence on bbox quality: if the bbox covers background or adjacent structures, the segmentation result will also be affected.
Table 41-3 summarizes the corresponding comparison and engineering considerations.
Table 41-3: Case B.6: Three Tools and Their Boundaries.
| Tool | Main Input | Return | Best For | Risks to Control |
|---|---|---|---|---|
Zoom-in |
Image index, bbox coordinates | Local crop image | Region too small, whole-image resolution insufficient, detail review needed | Bbox drift, over-cropping, context loss |
BiomedParse |
Image index, medical semantic description | Medical structure or lesion segmentation | Need to locate a structure or lesion by medical concept | Inaccurate description, insufficient modality generalization, wrong segmentation |
SAM2 |
Image index, bbox coordinates | Mask corresponding to the bbox prompt | Candidate box exists and boundary refinement is needed | Strong dependence on bbox quality; may include background |
Together, these tools form a limited but representative action space. The model does not need unlimited tools; it needs to make reasonable choices inside a bounded tool set. For data engineering, more tools are not necessarily better. As the number of tools grows, call formats, error modes, and quality checks all become more complex. A safer approach is to begin with a small number of tools whose boundaries are clear and whose inputs and outputs are verifiable, so the model can learn the basic evidence-acquisition loop.
Tool boundaries must also be stated clearly in system prompts and dataset documentation: Zoom-in is a cropping tool, not a diagnostic tool; BiomedParse is a medical image segmentation tool, not a generator of pathology conclusions; SAM2 is a general segmentation tool and does not understand clinical context. Only when these boundaries are explicit can training avoid confusing "obtaining visual evidence" with "replacing professional judgment." Segment Anything and MedSAM also remind us that the engineering capability of promptable segmentation should be separated from the interpretive boundaries of medical scenarios (Kirillov et al. 2023; Ma et al. 2024).
Case B.7: Organizing Tool Trajectories as Multi-Turn Samples
The core of a tool trajectory is multi-turn structure. It is not a matter of writing a tool call into the same text paragraph; it separates the tool action from the tool observation so the model experiences an "act, observe, continue judging" process during training (Yao et al. 2023).
Figure 41-7 illustrates the corresponding workflow or structure.

Figure 41-7: Multi-turn structure of a tool-call trajectory. Tool observations return as new image inputs; the model must continue reasoning from the observation image rather than merely produce a formally correct call.
A simplified trajectory has four steps. The user provides the original image, question, and options. The assistant decides local evidence is needed and outputs a structured tool call. The environment returns a new observation image. The assistant uses both original and observation images to answer.
Listing 41-8 provides a visual reasoning prompt example.
User:
<image>
Question:
Which description best matches the target region in this medical image?
Options:
A. A focal abnormality with a relatively clear boundary
B. Diffuse background change
C. Consistent with normal anatomy
D. Mainly caused by imaging artifact

Assistant:
The question asks about a local finding. The whole image suggests a target region,
but boundary and density detail are insufficient. I need to zoom in.
<tool_call>
{"name":"Zoom-in","arguments":{"target_image":1,"bbox_2d":[132,184,278,336]}}
</tool_call>

User:
<image>
The tool returned a local zoom observation. Continue based on the new evidence.

Assistant:
The local observation shows a distinguishable target region with a relatively clear
boundary compared with the background. It is not diffuse change and is less likely
to be only artifact.
<answer>A</answer>
Listing 41-8: Visual reasoning prompt example.
Tool arguments must be structured. Tool returns must become new multimodal input, not a text note saying “already zoomed.” The final answer should consume the observation. The trajectory should avoid diagnostic claims and stay within the option-comparison task.
Multi-turn trajectories can also contain multiple tool calls. For example, the model may first use Zoom-in to inspect a local region and then use SAM2 to obtain a more precise boundary; or it may first use BiomedParse to localize a lesion by semantic description and then use local observation to confirm appearance. Multi-tool trajectories are valuable because they show progressive evidence acquisition, but they also require stricter validation. Each additional tool call adds another risk of parameter error, observation mismatch, or overuse.
For this reason, it is reasonable for MedImage-ToolVQA to preserve a portion of direct visual reasoning samples. Direct samples tell the model that tools are not mandatory actions but on-demand actions. A mature medical image agent should not call a tool merely to display tool capability. It should call a tool when whole-image information is insufficient, local detail is decisive, or the region boundary needs confirmation. This "on demand" behavior is the real policy that tool-use supervision is meant to train.
Case B.7.1 Three-Layer Reading of a Sample
Each record can be read at three layers:
- Question layer: image, question, options, and answer.
- Evidence layer: ROI, bbox, mask, local observation image, and target description.
- Behavior layer: tool call, observation return, continued judgment, and final answer.
All three layers must work. If the question is good but evidence is missing, it is ordinary VQA. If evidence exists but behavior ignores the observation, it is VQA with extra annotations. If behavior is complete but the question is text-answerable, the tool call becomes formal decoration.
From a training perspective, the three layers correspond to different losses or evaluation concerns. The question layer determines final-answer supervision. The evidence layer determines image grounding and region consistency. The behavior layer determines Tool-Use format and action strategy. A training system can use only part of these layers, but the less it uses, the narrower the capability it learns. Using only the question layer trains medical VQA; adding the evidence layer can train or evaluate local grounding; adding the behavior layer enters evidence-acquisition trajectory learning for medical image agents.
From a data-governance perspective, the three layers also correspond to different owners. Medical content experts are better suited to review whether questions and answers are reasonable. Visual data engineers are better suited to review whether ROI, masks, and observation images are consistent. Agent or training engineers are better suited to review tool format, trajectory structure, and reward interfaces. Separating these layers reduces ambiguity in collaboration. Otherwise, when a sample fails, the team may only say "this data is bad" without knowing whether the problem lies in the question, the region, or the trajectory.
Case B.7.2 Difference from Ordinary Chain-of-Thought
Tool trajectories are sometimes confused with chain-of-thought data. Both include intermediate process, but the training meaning differs. Ordinary CoT unfolds in text. Tool trajectories include external actions and environment feedback: the model calls a tool, receives a new observation, then continues. It does not merely “think in more detail”; it sees something new.
This matters in medical images. A model can write “I need to inspect the local region” without obtaining a local image. A tool trajectory requires the model to actually call zoom or segmentation and use the returned image.
Ordinary CoT quality mainly depends on whether the reasoning text is coherent and supports the answer. A tool trajectory additionally requires checking whether the action is executable, whether tool parameters are correct, and whether the observation corresponds to the action. For example, a model may say it will zoom into the upper-right region while the bbox actually points to the lower-left region; or a tool may return a local crop, but the model continues to refer to another region in the original image. Such errors may not exist in ordinary CoT, but they must be identified in tool trajectories.
This is also why tool-use data should not compress the whole trajectory into one assistant message. If the tool call and observation return are folded into one text block, the model never experiences environment feedback. The meaning of multi-turn structure is that the model acts first, receives the result later, and then continues judging. This structure is closer to a real agent and easier to connect to a later tool environment.
Tool trajectories do not exclude short explanations. Before calling a tool, the model can explain why local evidence is needed; after the observation returns, it can explain how the observation affects option comparison. But these explanations should serve action and evidence, not dominate the sample. In medical image scenarios, overly long, overconfident, or overly diagnostic reasoning can itself create risk. A safer style is to give limited explanation around the question options and visual evidence.
Thus, a tool trajectory can be understood as process supervision with external observation. It is finer-grained than answer supervision, more executable than pure-text CoT, and more auditable than a black-box tool policy. The data-engineering value of MedImage-ToolVQA lies precisely in this organization of process supervision.
Case B.8: SFT Data and RL Data
Tool trajectories can support both SFT and RL, but the two stages care about different things. SFT is closer to behavior demonstration: its goal is to teach the model format, order, and basic strategy. RL is closer to policy optimization: its goal is to let the model choose more effective behavior under reward feedback.
In SFT, clarity and stability matter most. The model must learn that <tool_call> contains parseable JSON, that an observation image appears after a tool return, and that the final answer is placed consistently. If SFT format is unstable, RL environments cannot parse actions reliably.
Medical image SFT records should also keep an imaging-task schema. Here “diagnosis” means structuring the training task, candidate labels, evidence region, and safety boundary; it does not ask the model to provide clinical conclusions.
Figure 41-8 illustrates the corresponding workflow or structure.

Figure 41-8: Bbox is a structured field and should be recoverable as reviewable visual evidence.
Image source: VQA-RAD test split, Hugging Face dataset flaviagiammarino/vqa-rad, CC0-1.0. The figure is a resampled derived image used to illustrate correspondence among original image, bbox overlay, and local crop.
Listing 41-9 provides an error-log example.
{
  "sample_id": "medimage_toolvqa_xray_chest_000184",
  "task_type": "medical_image_vqa_with_tool_use",
  "image_context": {
    "modality": "X-ray",
    "body_part": "chest",
    "view_or_series": "frontal chest radiograph",
    "image_role": "original_image",
    "figure_ref": "ch41_aux_sft_schema_real_chest_xray.png",
    "source_dataset": "VQA-RAD",
    "source_split": "test",
    "source_url": "https://huggingface.co/datasets/flaviagiammarino/vqa-rad",
    "license": "CC0-1.0",
    "derivation": "resized tool-observation example",
    "deidentification": "metadata_removed"
  },
  "diagnosis_schema": {
    "clinical_scope": "training_and_evaluation_only",
    "diagnostic_task": "chest_xray_focal_opacity_characterization",
    "target_finding": "focal opacity candidate",
    "anatomical_location": "right lung field",
    "candidate_labels": [
      {"choice": "A", "label": "focal opacity with relatively clear boundary"},
      {"choice": "B", "label": "diffuse bilateral background opacity"},
      {"choice": "C", "label": "linear or band-like opacity"},
      {"choice": "D", "label": "imaging artifact without focal opacity"}
    ],
    "gold_choice": "A",
    "answer_boundary": "select_from_candidates_only",
    "not_for_clinical_diagnosis": true
  },
  "visual_evidence": {
    "roi_id": "roi_000184_01",
    "bbox_2d": [593, 199, 839, 524],
    "bbox_overlay_ref": "ch41_aux_sft_schema_bbox_overlay.png",
    "crop_ref": "ch41_aux_sft_schema_zoom_roi.png",
    "target_description": "right lung field focal opacity candidate",
    "evidence_requirements": [
      "verify focality",
      "compare boundary clarity",
      "exclude diffuse background opacity or artifact"
    ]
  },
  "messages": [
    {
      "role": "user",
      "content": [
        {"type": "image", "image_id": "image_000184_chest_xray"},
        {
          "type": "text",
          "text": "Which option best describes the target region in this frontal chest X-ray?\\nA. A focal high-density opacity with relatively clear boundary\\nB. Diffuse bilateral background density increase\\nC. Linear or band-like opacity\\nD. Imaging artifact without focal opacity"
        }
      ]
    },
    {
      "role": "assistant",
      "content": [
        {"type": "text", "text": "The whole image suggests a local region in the right lung field that needs review, but boundary and density details are insufficient. I should zoom in."},
        {
          "type": "tool_call",
          "name": "Zoom-in",
          "arguments": {"target_image": 1, "bbox_2d": [593, 199, 839, 524]}
        }
      ]
    },
    {
      "role": "user",
      "content": [
        {"type": "image", "image_id": "image_000184_zoom_roi_01", "source_tool": "Zoom-in", "figure_ref": "ch41_aux_sft_schema_zoom_roi.png"},
        {"type": "text", "text": "The tool returned a local zoom observation. Continue based on the new evidence."}
      ]
    },
    {
      "role": "assistant",
      "content": [
        {"type": "text", "text": "The local observation supports a focal high-density opacity with a relatively clear boundary. It does not match diffuse background change or a purely linear opacity."},
        {"type": "answer", "choice": "A"}
      ]
    }
  ],
  "quality_control": {
    "image_dependency": "required",
    "tool_use_label": "necessary",
    "schema_valid": true,
    "review_status": "passed_with_nonclinical_scope"
  }
}
Listing 41-9: JSON data example.
The point of this schema is not to teach the model "how to diagnose a chest X-ray." It lets a training record answer five engineering questions at the same time: what medical imaging task this is, where the candidate-label boundaries are, which ROI provides the visual evidence, whether the tool call is executable, and whether the final answer stays within the candidates allowed by the question. Without diagnosis_schema, an SFT sample can still train format, but later quality checks, stratified evaluation, and human review will struggle to distinguish "medical label error," "region evidence error," and "tool behavior error."
In RL, the data must further expose reward and environment interfaces. After the model outputs a tool call, the environment can validate whether the tool name is legal, whether parameters conform to the schema, whether the bbox is out of bounds, and whether the image index exists. After the model outputs an answer, rule rewards can compare whether the final option is correct. More complex rewards can also consider whether tool use was necessary, whether the model over-called tools, and whether it actually used the observation image.
The relationship between the two stages can be summarized as follows: SFT first teaches the model how to perform a legal action; RL then tries to optimize when that action is appropriate. If SFT is skipped, the model may not even produce stable tool formats. If SFT is used without later policy feedback, the model may learn superficial trajectories but fail to improve tool choice on complex problems.
RL does not automatically solve data problems. If many SFT samples contain unnecessary tool calls, the initial RL policy will be affected. If rewards only check the final answer, the model may learn to underuse or misuse tools as long as it occasionally answers correctly. Therefore, reward design for medical image tool-use data should be coordinated with data quality control. Correct final answers are necessary, but they are not the only objective. Tool-call legality, evidence relevance, and safety boundaries should also become part of evaluation.
Case B.9: Common Failure Modes
Tool-use data looks richer than ordinary VQA, but it also creates new failure modes. Understanding these failures helps readers move from "building a pipeline" to "governing data."
The first failure is a text-answerable question. The question appears to come from medical imaging, but the answer only depends on medical common sense. For example, if the prompt asks which organ is associated with a common pulmonary imaging finding, a model can answer without looking at the image. Such samples weaken image dependency and may even teach the model to ignore visual input. Filtering text-answerable questions is a basic threshold for medical VQA data engineering.
The second failure is localization leakage. The prompt directly says "inside the annotated box," "in the mask region," or "at the red outline," so the model does not need to decide where to attend. These samples reduce tool use to surface format rather than evidence strategy. Localization leakage is especially easy to introduce when questions are automatically generated from annotation data, so it needs both text rules and manual spot checks.
The third failure is irrelevant ROI. The question, answer, and target region do not have a strong relationship. This may come from region annotation errors, or from question generation drifting away from the target description. Irrelevant ROI is more hidden than format error because the sample can look structurally complete and the answer can seem plausible. Solving it requires checking the image, target region, description, and answer together.
The fourth failure is invalid tool calling. A model or synthesizer may generate illegal tool parameters: out-of-bounds bbox, nonexistent image index, inconsistent tool-name spelling, or missing argument fields. Such errors directly affect training and environment interaction. For tool-use data, schema validation is not an optional extra step; it is required.
The fifth failure is observation not consumed. The model calls a tool and the tool returns an observation image, but the later answer does not reflect use of that observation. The trajectory is complete in format but incomplete in behavior. It trains the model to treat tool calls as a fixed template rather than as evidence acquisition.
The sixth failure is over-calling. The model calls a tool even when the whole image is sufficient, or it calls multiple tools in sequence without gaining new information. Over-calling increases inference cost and can introduce latency and error accumulation in a real system. The training set therefore needs to preserve a certain proportion of direct visual reasoning samples, and evaluation should distinguish necessary tool use from formalized tool use.
Table 41-4 summarizes the corresponding comparison and engineering considerations.
Table 41-4: Case B.9: Common Failure Modes.
| Failure Mode | Symptom | Risk | Governance Method |
|---|---|---|---|
| Text-answerable question | Can answer without image | Model ignores visual input | No-image check, rewrite or filter |
| Localization leakage | Prompt exposes bbox/mask | Model does not learn active localization | Text rules, manual spot checks, generation constraints |
| Irrelevant ROI | Region and question target mismatch | Tool trajectory loses evidence meaning | Joint image-region-description-answer check |
| Invalid tool call | Bad JSON, bbox out of bounds, missing index | Environment cannot execute | Schema validation, parameter boundary checks |
| Observation not consumed | Tool called but answer ignores observation | Tool behavior becomes template | Trajectory audit and regeneration |
| Over-calling | Tool used for easy whole-image questions | Higher cost and rigid policy | Keep direct samples; evaluate necessity |
These failure modes show that tool-use data quality is not determined by answer correctness alone. A tool trajectory sample should pass at least three classes of checks at the same time: whether the question needs visual evidence, whether the tool action is reasonable and effective, and whether the final answer correctly consumes the observation. Without any one of these checks, the data may become structurally complex but have limited supervision value.
Case B.10: Quality Control and Human Review
Quality control for medical image tool-use data should be layered, rather than postponed until final packaging. A more reasonable approach is to set gates separately at question generation, region validation, tool-observation generation, trajectory synthesis, and training packaging.
Figure 41-9 illustrates the corresponding workflow or structure.

Figure 41-9: Quality-control and human-review gates. Medical image tool-use data needs to check answer, evidence, and behavior together; automated validation and human review should complement each other.
The first layer is structure validation: prompt, options, answer, image references, region fields, and tool parameters must be complete and parseable. Tool names must come from a whitelist; bbox coordinates must be in bounds.
The second layer is image-dependency validation. Use no-image checks, teacher-model judgments, or human sampling to detect text-answerable questions.
The third layer is region-consistency validation. Question, answer, target description, and local image should point to the same visual object.
The fourth layer is tool-effectiveness validation. Tool arguments must execute, observation images must be generated, and later trajectory turns must reference the observation correctly.
The fifth layer is human review. High-risk or low-confidence samples enter a review queue: conflicting automated checks, weak ROI/question alignment, high-risk medical topics, abnormal tool-call counts, missing observations, or observation-not-consumed trajectories. Review roles should be separated: medical content reviewers check questions and answers; visual data reviewers check ROI/mask/bbox; tool-trajectory reviewers check schema and multi-turn order.
Review results should not be only pass/fail. Better categories are passed, revise, downgrade, and discard, with reasons written back into version records.
Human review should not be treated as a requirement that every sample be audited one by one by experts. Instead, high-risk or low-confidence samples should be routed into a review queue. The queue can be triggered by four types of conditions: low automated validation scores or multiple conflicting rules; weak consistency between bbox, mask, and question target; high-risk medical topics such as suspected malignancy, critical illness, pediatric imaging, or rare disease presentations; and trajectories with abnormal tool-call counts, missing observations, or observations that are not consumed. The goal is not to hand every decision to humans, but to expose the least stable parts of the automated system.
Reviewer roles also need to be separated. Medical content reviewers should focus on whether questions, options, and answers are out of scope or misleading. Visual-evidence reviewers should focus on whether ROI, mask, bbox, and observation images correspond. Tool-trajectory reviewers should focus on tool names, parameter schemas, multi-turn order, and observation consumption. For high-risk medical samples, at least one reviewer with relevant medical background should participate. For ordinary format and flow issues, data engineering or training engineering roles can perform the first pass.
The result categories should be written back into data version records, preserving review reasons, processing actions, and downstream destination. In this way, human review is not only a one-time gate; it also improves question generation, tool-parameter constraints, and quality-filtering rules.
Quality control also needs to record pass rates and failure reasons. Knowing only how many samples remain at the end is not enough. Teams should also record how many samples were filtered because they were text-answerable, how many were rewritten because of localization leakage, how many were discarded because of invalid tool parameters, and how many entered human review. These statistics help explain later training results and quickly localize issues during dataset version updates.
Case B.10.1 Evaluation Protocol
Evaluation for medical image tool-use data cannot retain only ordinary VQA accuracy. Accuracy is still important, but it covers only the final answer, not tool behavior. A model may answer correctly while calling a tool on an irrelevant region. It may also call a reasonable tool but answer incorrectly because of option confusion. These two cases mean very different things for data engineering and model improvement. If evaluation only checks final options, many process problems remain hidden.
A more reasonable evaluation should contain at least four layers:
- Answer layer: final multiple-choice correctness.
- Format layer: valid tool name, JSON structure, argument types, and required fields.
- Behavior layer: whether tool calls are necessary, directed to plausible regions, and not excessive.
- Evidence layer: whether the model uses the observation after it is returned.
The answer layer is easiest to compute and easiest to mislead with. In medical multiple-choice questions, if option distribution is imbalanced, a model may obtain a superficially good accuracy by favoring high-frequency options. Therefore, besides aggregate accuracy, teams should report per-option accuracy, accuracy for different tool types, direct-sample accuracy, and tool-enhanced-sample accuracy. Only then can they tell whether the model is stable across sample types.
The format layer mainly supports engineering stability. Once a tool call has invalid format, the environment cannot execute it. Common issues include unparseable JSON, inconsistent capitalization in tool names, bbox not containing four numbers, non-integer image index, and schema-mismatched field names. Format metrics do not necessarily reflect medical capability, but they determine whether the system can run. For Tool-Use data, format stability is the prerequisite for further evaluation.
The behavior layer is closer to the theme of this chapter. It asks whether the model calls tools at appropriate moments. If a sample can be answered directly from the whole image but the model frequently calls a tool, the policy may be overly conservative. If a sample clearly requires local evidence but the model answers directly, the model may not have learned to recognize insufficient evidence. Behavior evaluation can use sample labels, manual sampling, or rule heuristics; it does not need to be fully automated at once.
The evidence layer is the hardest but also the most valuable. It asks whether the model updates its judgment from new visual evidence after the observation image returns. A simple method is to check whether the answer text refers to local observation. A stricter method compares model outputs with and without the observation image. A further method asks a reviewer model or human annotator to judge whether the explanation is consistent with the observation. Evidence evaluation should not rely completely on surface language, because a model can produce plausible explanations that do not actually correspond to the image.
In addition to automated metrics, medical image tool-use data needs sampled audit. Sampling should not include only samples with wrong final predictions; it should also include samples with correct predictions but abnormal tool behavior. Process errors may not affect the answer temporarily, but they can be amplified in more complex or higher-risk scenarios. A stable audit pool can include samples with abnormal tool-call counts, bboxes close to boundaries, low answer confidence, conflicts between automated evaluation and human judgment, and high-risk medical topics.
The evaluation principle is: answer correctness is only the first layer; reasonable behavior is the full target.
Case B.10.2 Data Cards and Version Notes
If a specialized dataset remains only at the sample-file level, later teams will struggle to reuse it reliably. Medical image tool-use data is especially in need of a data card and version notes because it contains images, region evidence, tool trajectories, answers, and safety boundaries. A data card is not an appendix; it is part of dataset maintainability (Gebru et al. 2021).
A data card should describe task definition, data composition, construction flow, tool specifications, quality control, and compliance boundary. It should state that the data is for medical image multiple-choice VQA and tool-use behavior training, not direct clinical diagnosis.
Version notes should record changes in sample membership, annotations, tool schema, bbox conventions, observation generation, trajectory templates, and reward fields. For example, changing crop padding changes local observation content; renaming a tool argument changes action format; filtering text-answerable samples changes difficulty. Without version notes, training differences are hard to attribute.
A data card should also distinguish known capabilities from uncovered capabilities. MedImage-ToolVQA can train a model to perform local evidence acquisition within a given tool space, but that does not mean the model has complete clinical reasoning ability or that all medical modalities are sufficiently covered. If the data mainly comes from certain image types or region sources, the coverage should be stated honestly. Neutral data documentation is more valuable than exaggerated capability claims because it helps users judge applicability boundaries.
For teaching and research use, the data card can also provide suggested experiments, such as comparing direct VQA samples with tool-enhanced samples, comparing model answers with and without observation images, and comparing tool-call rates under SFT-only training versus SFT plus RL. These experiments do not need to be written as result promises; they can serve as entry points for readers to understand the data mechanism.
From a long-term maintenance perspective, data such as MedImage-ToolVQA is more like a training asset than a one-time data file. Its value comes from the combination of samples, tools, evaluation, and documentation. Only when data cards, version records, quality statistics, and risk boundaries are maintained together can later teams use the dataset without rediscovering every detail from scratch.
Case B.11: Medical Privacy and Compliance Boundaries
Medical images involve personal privacy and sensitive health information. Even when images do not show names, metadata, image corner labels, exam IDs, timestamps, institution names, and report snippets may reveal identity. Before training or publication, data should be de-identified by removing direct identifiers, embedded image text, sensitive paths or filenames, and by recording source and authorization.
Tool-use data increases privacy risk because derived images are also data. Original images, local crops, mask overlays, and segmentation images may all contain identifiable information. De-identification must cover all derived images, not only the original.
Use boundaries must be explicit. MedImage-ToolVQA is for research, training, and evaluation of medical image tool-use behavior. It is not a clinical diagnosis system. Data cards and model cards should state that outputs cannot replace professional medical judgment and real applications require qualified review (Mitchell et al. 2019).
Tool boundaries also matter. Zoom-in crops images; BiomedParse and SAM2 segment or localize. They should not be presented as disease-diagnosis tools. Language in training data should describe acquiring local visual evidence, observing boundaries, and comparing options, not confirming diagnoses.
It is also necessary to guard against overconfident statements in tool trajectories. Medical image questions often contain uncertainty, and training samples should not package limited visual evidence as absolute conclusions. For multiple-choice questions, the model can be required to answer within the option range, but explanations and dataset documentation should avoid extending option answers into clinical advice.
Case B.12: Relation to Multimodal Agent Data Engineering
MedImage-ToolVQA is not only a medical case. It provides a general pattern: when a model needs tools to obtain new evidence, training data should record the action-observation-update loop. The same idea applies to multimodal RAG, document understanding, table QA, chart reasoning, and robotic perception.
Compared with static multimodal instruction data, tool-use samples emphasize environment feedback. A model can change what it sees by calling a zoom tool, seeing a mask, or retrieving evidence. Data engineering must therefore move from static sample design to trajectory sample design.
Trajectory sample design has several basic principles. First, the action space should be limited and clear: tool names, parameters, and returns should all be verifiable. Second, observation results should really enter later context rather than exist only as comments. Third, rewards and quality control should cover behavior, not only final answers. Fourth, high-risk domains must include safety boundaries and human review.
These principles also explain why MedImage-ToolVQA belongs in the part on specialized datasets and data engineering practice. It is not simply an introduction to a medical dataset. It is a case that connects multimodal data, tool use, agent trajectories, and compliance governance. Looking backward, it connects image-text alignment, visual grounding, and multi-turn Tool-Use. Looking forward, it supports VLM data recipes and Agent Tool-Use projects.
For readers, the main takeaway is not a specific tool name but a way of thinking: when a model faces a problem that requires active evidence acquisition, the dataset cannot record only the question and answer. It also needs to record where the evidence comes from, how the action is produced, how the observation returns, how the answer is updated, and how the whole process is validated.
Case B.12.1 Migrating the Pattern
The same structure can be migrated to document QA with page-region zoom, chart QA with subchart localization, remote sensing with region retrieval, or industrial inspection with defect zoom. What changes is the evidence object and tool boundary. Medical data uses ROI, mask, and bbox; document data may use page regions, table cells, and OCR coordinates; chart data may use axes, legends, and curve segments.
Three things need to be preserved during migration. The first is the evidence object. In medical images, evidence objects are ROI, masks, and bboxes; in document settings, they may be page regions, table cells, and OCR coordinates; in chart settings, they may be axes, legends, and curve segments. Different scenarios use different evidence objects, but all of them need structured representation.
The second is the tool boundary. Medical image tools are zooming, semantic segmentation, and geometric segmentation; document tools may be OCR, table parsing, and page retrieval; chart tools may be value reading, subchart cropping, and coordinate mapping. Whatever the tool is, its inputs, outputs, failure conditions, and prohibited uses should be explicit. The more ambiguous a tool is, the easier it is for training data to turn actions into generic explanations.
The third is observation consumption. Tool returns must change the visible information in the later context and be used by the model for the next judgment. If a tool call is only a formal fragment of a trajectory and the observation never enters context, it has limited value for training behavior policy. When readers migrate this chapter's method, the most important check is not whether the tool names are rich enough, but whether the new evidence returned by tools truly changes the model's visible world.
Thus, MedImage-ToolVQA can be viewed as a template: define evidence objects first, then define tool actions, and then explicitly write the observations returned by those actions into multi-turn samples. The concrete fields will vary by scenario, but the core logic is stable. This template helps data engineering teams move from static sample design to trajectory sample design, and it helps evaluation expand from single answer accuracy to action rationality.
Case B.12.2 Connection with Other Chapters
Placed back into the structure of the whole book, this chapter connects several main threads. Part 3 discusses image-text pairs, multimodal cleaning, and cross-modal alignment, providing the visual data foundation that medical images need before entering a model. Without image quality control, resolution handling, and local grounding, later tool-call trajectories lack reliable inputs.
Part 6 discusses Tool-Use and Agent data, providing the basic concepts of action spaces, tool schemas, and multi-turn trajectories. This chapter places those concepts in medical images and shows that tool use is not only a text-agent capability; it can also become a data object for visual agents. It extends tasks such as calling a search tool into multimodal tasks such as calling a visual tool to re-observe an image.
Following that thread, Part 10 further discusses how data engineering agents are constrained by tool boundaries, security permissions, and human collaboration in real data engineering workflows. Although this chapter focuses on a medical image dataset, tool whitelists, parameter schemas, observation-image audits, and human-review gates handle the same class of problem: when a model or data builder is allowed to act, data engineering must specify what it can do, what evidence remains after it acts, and which steps need human handoff.
Part 11 provides the risk boundary through privacy, compliance, and data security. Medical image data cannot be handled only according to technical feasibility; de-identification, authorization, audit, and misuse risk must also be considered. Tool-use samples introduce more derived images and therefore more objects that need governance.
Parts 13 and 14 focus more on training recipes and project practice. The medical image tool trajectories in this chapter can serve as a preceding case for VLM instruction data, Agent Tool-Use factories, and multimodal RL data. Readers who later design their own multimodal tool-use projects can treat this chapter as an intermediate bridge: it is neither pure concept introduction nor reproduction of a single project, but a transferable method that organizes data structure, tool behavior, and quality boundaries.
This cross-chapter relationship also reminds us that the significance of a specialized dataset is not merely the introduction of a data object. More importantly, it helps readers recombine methods learned earlier in the book. Medical images are the carrier; the real theme is how data engineering should record evidence, action, feedback, and risk when models actively gather evidence in visual environments.
Case B: Summary
MedImage-ToolVQA extends medical image VQA from single-step answer supervision to multi-turn supervision containing local visual evidence and tool-use behavior. It organizes ROI, mask, bbox, target description, tool observations, and multiple-choice answers into one evidence chain, so models learn not only what to answer, but how to obtain and use visual evidence.
The advantage is stronger interpretability and auditability: tool parameters, observation images, and final answers can be checked together. The cost is higher data-engineering burden: each stage needs validation, each tool needs a boundary, and each derived image needs tracing and de-identification. In a high-risk setting such as medical imaging, the dataset also encodes behavioral rules: when to inspect directly, when to call tools, how to update after observation, and which answers require quality control, privacy protection, and human review.
Chapter Summary
This chapter placed multi-chart infographic reasoning and medical-image tool calling in the same line of visual reasoning data engineering. Multi-chart infographic tasks emphasize cross-chart evidence aggregation, multi-step calculation, and question-structure control. Medical-image tool-calling tasks emphasize local evidence, tool behavior, derived observations, and audit boundaries in high-risk settings. Both cases show that the key to a visual reasoning dataset is not merely having images, questions, and answers, but organizing evidence sources, reasoning steps, tool actions, and quality controls explicitly.
The main method in this chapter is to decompose visual reasoning tasks into annotatable, trainable, and evaluable data interfaces. Chart-based scenarios require controlled question types, evidence chains, and calculation paths; medical scenarios require controlled regions of interest, tool parameters, observation results, and compliance review. Such structured design helps models move from passive recognition toward active evidence gathering, and it provides reusable engineering templates for VLM instruction data, agent data, and multimodal reinforcement-learning data.
References
Masry A, Long D X, Tan J Q, Joty S, Hoque E (2022) ChartQA: A Benchmark for Question Answering about Charts with Visual and Logical Reasoning. ACL 2022. https://doi.org/10.18653/v1/2022.findings-acl.177.
Methani N, Ganguly P, Khapra M M, Kumar P (2020) PlotQA: Reasoning over Scientific Plots. WACV 2020. https://doi.org/10.1109/wacv45572.2020.9093523.
Kahou S E, Michalski V, Atkinson A, Kádár Á, Trischler A, Bengio Y (2017) FigureQA: An Annotated Figure Dataset for Visual Reasoning. arXiv:1710.07300.
Kafle K, Price B, Cohen S, Kanan C (2018) DVQA: Understanding Data Visualizations via Question Answering. CVPR 2018. https://doi.org/10.1109/cvpr.2018.00592.
Mathew M, Karatzas D, Jawahar C V (2021) DocVQA: A Dataset for VQA on Document Images. WACV 2021. https://doi.org/10.1109/wacv48630.2021.00225.
Masry A, Islam M S, Ahmed M, Bajaj A, Kabir F, Kartha A, et al. (2025) Chartqapro: A more diverse and challenging benchmark for chart question answering. In Findings of the Association for Computational Linguistics: ACL 2025 (pp. 19123-19151). https://doi.org/10.18653/v1/2025.findings-acl.978.
Xie T, Lin M, Liu M, Ye Y, Chen C, Liu S (2026) Infochartqa: A benchmark for multimodal question answering on infographic charts. Advances in Neural Information Processing Systems, 38.
Foroutan N, Romanou A, Ansaripour M, Eisenschlos J M, Aberer K, Lebret R (2025) Wikimixqa: a multimodal benchmark for question answering over tables and charts. In Findings of the Association for Computational Linguistics: ACL 2025 (pp. 24941-24958).
Zhu Z, Jia M, Zhang Z, Li L, Jiang M (2025) MultiChartQA: Benchmarking vision-language models on multi-chart problems. In Proceedings of the 2025 Conference of the Nations of the Americas Chapter of the Association for Computational Linguistics: Human Language Technologies (Volume 1: Long Papers) (pp. 11341-11359).
Antol S, Agrawal A, Lu J, Mitchell M, Batra D, Zitnick C L, Parikh D (2015) VQA: Visual Question Answering. Proceedings of the IEEE International Conference on Computer Vision, 2425-2433. https://doi.org/10.1109/ICCV.2015.279.
Lau J J, Gayen S, Ben Abacha A, Demner-Fushman D (2018) A dataset of clinically generated visual questions and answers about radiology images. Scientific Data, 5, 180251. https://doi.org/10.1038/sdata.2018.251.
He X, Zhang Y, Mou L, Xing E, Xie P (2020) PathVQA: 30000+ Questions for Medical Visual Question Answering. arXiv:2003.10286.
Liu B, Zhan L-M, Xu L, Ma L, Yang Y, Wu X-M (2021) SLAKE: A Semantically-Labeled Knowledge-Enhanced Dataset for Medical Visual Question Answering. IEEE 18th International Symposium on Biomedical Imaging. https://doi.org/10.1109/ISBI48211.2021.9434010.
Yao S, Zhao J, Yu D, et al. (2023) ReAct: Synergizing Reasoning and Acting in Language Models. International Conference on Learning Representations. arXiv:2210.03629.
Schick T, Dwivedi-Yu J, Dessi R, et al. (2023) Toolformer: Language Models Can Teach Themselves to Use Tools. Advances in Neural Information Processing Systems, 36. arXiv:2302.04761.
Kirillov A, Mintun E, Ravi N, et al. (2023) Segment Anything. Proceedings of the IEEE/CVF International Conference on Computer Vision, 4015-4026.
Ravi N, Gabeur V, Hu Y-T, Hu R, Ryali C, Ma T, et al. (2025) SAM 2: Segment Anything in Images and Videos. International Conference on Learning Representations.
Ma J, He Y, Li F, et al. (2024) Segment anything in medical images. Nature Communications, 15, 654. https://doi.org/10.1038/s41467-024-44824-z.
Zhao T, Gu Y, Yang J, et al. (2025) A foundation model for joint segmentation, detection and recognition of biomedical objects across nine modalities. Nature Methods, 22, 166-176. https://doi.org/10.1038/s41592-024-02499-w.
Gebru T, Morgenstern J, Vecchione B, Vaughan J W, Wallach H, Daume III H, Crawford K (2021) Datasheets for Datasets. Communications of the ACM, 64(12), 86-92. https://doi.org/10.1145/3458723.
Mitchell M, Wu S, Zaldivar A, et al. (2019) Model Cards for Model Reporting. Proceedings of the Conference on Fairness, Accountability, and Transparency, 220-229. https://doi.org/10.1145/3287560.3287596.